Biomedical Engineering Reference
In-Depth Information
Proliferating shell
10
2
Temperature (
°
C)
24
37
10
1
10
0
10
-1
10
-2
0.001
0.01
0.1
Frequency (Hz)
1
10
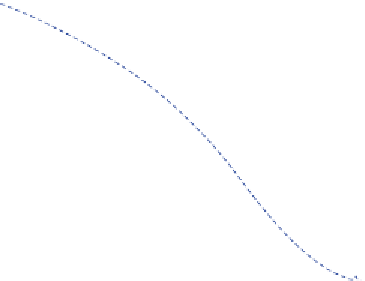
Figure 11.8
Spectral power density of the dynamic speckle from the proliferating shell at two temperatures.
cellular actions in response to the hypertonic insult. The effect of pH on the spectral
content is very similar to osmolarity. Acidic conditions are known to induce cell
swelling, and the spectral changes at low pH are consistent with hypotonic-induced cell
swelling. The spectral density changes for pH
5
5, 6, 8, and 9 are shown in
Figure 11.9B
, with many qualitative similarities to osmolarity-induced changes shown
in
Figure 11.9A
.
To make a more detailed comparison of the effects of osmolarity and pH, we define a time-
dependent differential spectral response as
S
ðω;
t
Þ
2
S
ðω;
0
Þ
Dðω; tÞ
5
S
ðω;
0
Þ
where the time-dependent changes in the spectral power density are related to the baseline
spectrum prior to the insult. The time-frequency data now represent a unique spectrogram,
like a voice print, for each applied drug, dose, or condition. A comparison of the
spectrograms subjected to osmolarity or pH is shown in
Figure 11.10
. Hypotonic
osmolarity of 154 Osm is compared to pH 6, and hypertonic osmolarity of 428 Osm is
compared to pH 8. The similarities are very strong for the hypertonic and alkaline
conditions and nearly as strong for hypotonic and acidic conditions. Under application of
154 Osm, the spectrogram shows a clear transient volume-regulatory response that is
entirely missing from the acidic pH spectrogram. This is consistent with the known
physiology of hypotonic osmolarity and pH
[21]
, in which pH-induced swelling does not


Search WWH ::

Custom Search