Biomedical Engineering Reference
In-Depth Information
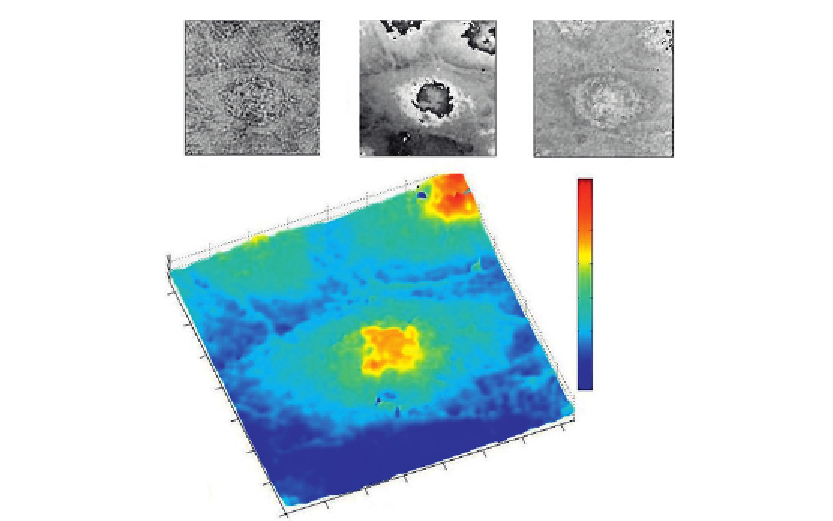
(A)
(B)
(C)
1333
nm
0
(D)
Figure 7.12
Confluent SKOV-3 ovarian cancer cells: (A) amplitude image, (B) reconstructed phase for
λ
5
532 nm, (C) dual-wavelength coarse phase image, and (D) 3D rendering of fine map. All
images are 92
μ
m
92
μ
m (240
240 pixels). The area at the bottom of the images is the
exposed part of the gold substrate.
3
3
The dual-wavelength phase imaging method has been applied to 3D imaging of ovarian
cancer cells (SKOV-3)
[3]
.
Figure 7.12A
shows the intensity image of a confluent group of
cells, which is similar to what one can see using an ordinary microscope.
Figure 7.12B
displays a single wavelength wrapped phase image,
Figure 7.12C
shows the coarse dual-
wavelength unwrapped phase image, and
Figure 7.12D
displays 3D rendering of the final
low noise “fine” map. To measure the physical thickness of cells by using
Eq. (7.5)
,we
need to make an assumption of the cell's refractive index,
n
5
1.375. Note that while it may
not be possible to precisely determine the refractive index of the cell at each individual
point, this number is always very close to the refractive index of water.
Figure 7.13
shows the image of a single (SKOV-3) cell, where the cell's nucleus and
pseudopodia are clearly seen. By using the phase to thickness conversion (
Eq. (7.5)
), we
can determine the 3D features of the cell.
Figure 7.13D
displays the line height profile,
which indicates, for example, that the overall cell height is about 1.47
μ
m, with the
thickness of the cell's pseudopodia (lamelipodia) at around 270 nm.
Search WWH ::

Custom Search