Biomedical Engineering Reference
In-Depth Information
(B)
(C)
(A)
rad
40
30
20
10
0
(E)
(D)
rad
20
15
10
5
0
(F)
(G)
(I)
(H)
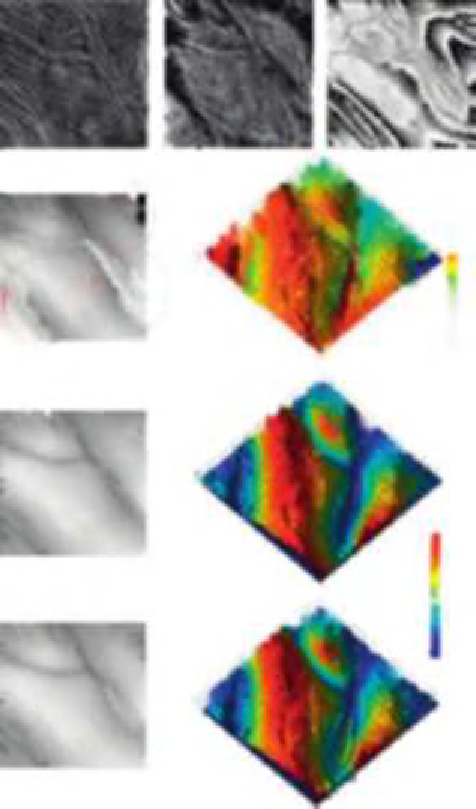
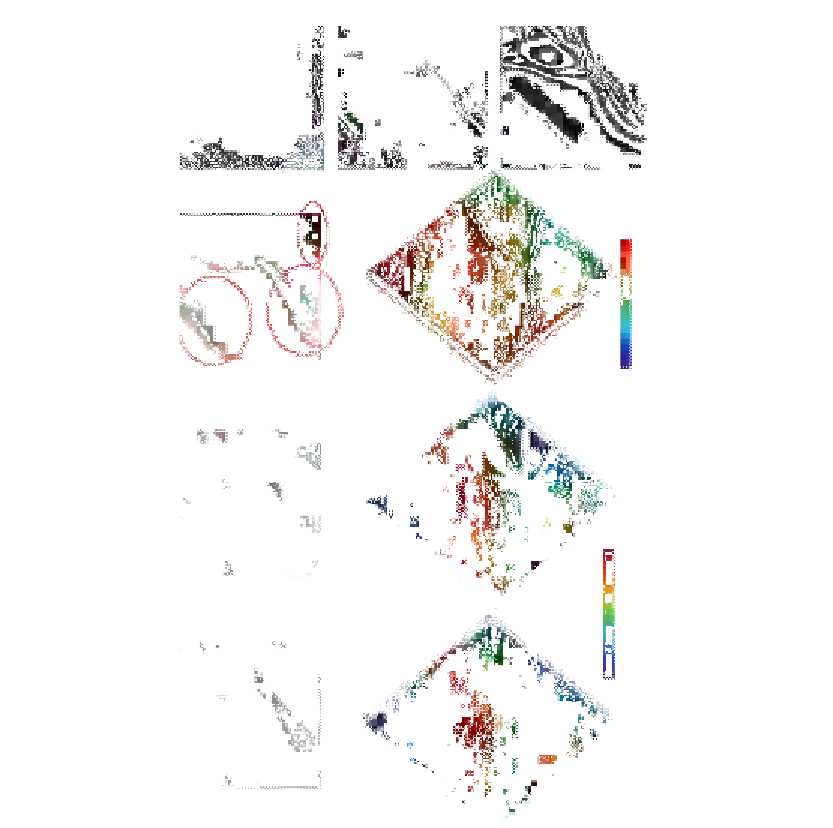
Figure 7.10
Onion cells—unwrapping: (A) hologram, (B) amplitude, (C) wrapped phase, (D) quality map
guided flood fill unwrapped phase with artifacts (shown), (E) 3D rendering of (D), (F) phase
unwrapping using varying reconstruction distance, (G) 3D rendering of (F), (H) phase
unwrapping using the addition of modulo of 2
π
(some artifacts are still seen), (I) 3D rendering of
(H). The images are 100
μ
m
100
μ
m (416
416 pixels).
3
3
The phase image displays multiple discontinuities and the intensity image shows that some
of the areas are either out of focus or too dark to provide a reliable phase signal. As a
result, the quality map guided algorithm produces multiple artifacts, which again propagate
into the areas of the image that are not noisy (
Figure 7.10D and E)
. In comparison, the
Search WWH ::

Custom Search