Biomedical Engineering Reference
In-Depth Information
(A)
(B)
Cell B
Cell b
1
Cell b
2
Cell A
Cell a
1
Cell a
2
(C)
(D)
Cell D
Cell d
1
Cell d
2
Cell C
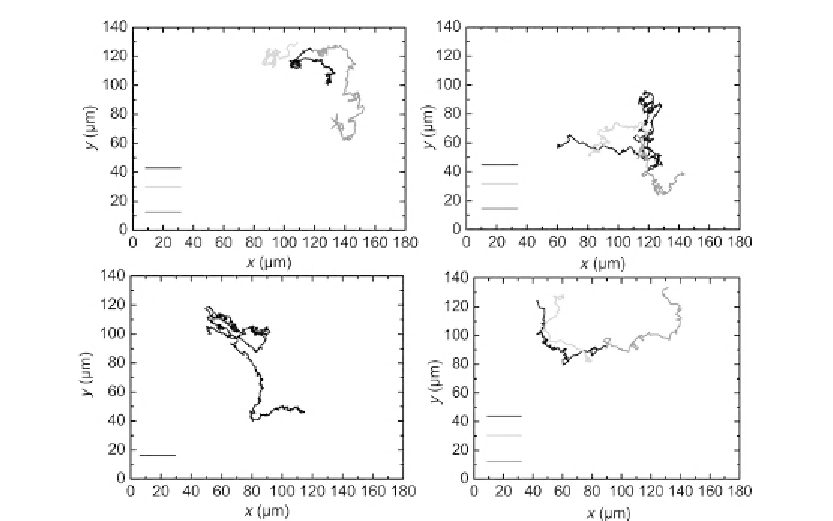
Figure 6.15
2D cell tracking in DHM phase contrast images in
Figure 6.11
. (A) Trajectories of cell A and
daughter cells a
1
,a
2
after cell division; (B) trajectories of cell B and daughter cells b
1
,b
2
after cell
division; (C) trajectory of cell C (no cell division); (D) trajectories of cell D and daughter cells d
1
,
d
2
after cell division
[82]
.
coordinates of the maximum phase contrast, the precision of the applied algorithm can be
estimated to be sensitive to cell thickness fluctuations.
Furthermore, the magnification of the applied experimental setup and disturbances in the
phase contrast images due to scattering effects, e.g., by the cell culture medium, have to be
taken into account. Thus, the error for the detection of the lateral cell position was
estimated by the fluctuations of the curves in
Figure 6.15
which are found in the range of
1
2
m. These values are specific for the applied measurements setup and amount in the
range of about 10% of the average lateral cell diameter. This is low in view of the cell
shape changes that are observed in the DHM phase contrast images in
Figure 6.12
and can
be explained as follows: For the cell cycle phases in which the cells adhere on the substrate,
the nucleoli predominate the coordinates of the maximum phase contrast. As the nucleoli
are located in the nucleus, the resulting
x
,
y
values can be expected to be a good
approximation of the cell center. The influence of cellular organelles other than the nucleoli
is expected to be small due to the applied smooth filter of 5
3
5 pixels. This is supported by
the small fluctuations in the
x
,
y
trajectories as in
Figure 6.15
, as well as by the fact that in
μ
Search WWH ::

Custom Search