Biomedical Engineering Reference
In-Depth Information
12 rad
t
= 0 h
t
= 14.3 h
t
= 18.4 h
t
= 18.7 h
Cell division
Cell division
t
= 19.7 h
t
= 32.4 h
t
= 32.5 h
t
= 33.5 h
0
Cell division
t
= 36.8 h
t
= 37.7 h
t
= 38.4 h
t
= 38.8 h
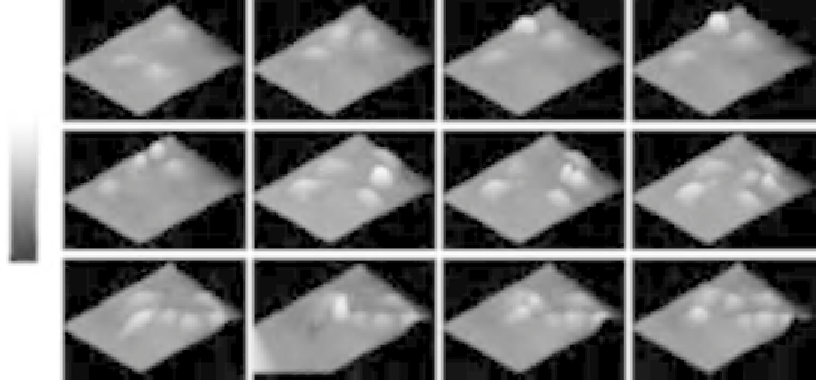
Figure 6.13
Gray level coded pseudo-3D representation of the quantitative contrast images of living HBMECs
shown in
Figure 6.12 [82]
.
Figure 6.14
shows for each cell the temporal dependence of the maximum phase
Δϕ
cell
;
max
as well as the corresponding cell thickness
d
cell,max
that is obtained from
Eq. (6.4)
by using
a value
n
cell
5
1.373 for the integral cellular refractive index that was retrieved from DHM
measurements on suspended HBMECs as described in
Section 6.4
. Prior to the cell division,
the cell morphology is changed to a spherical shape which causes a significant increase in
the maximum phase contrast and the cell thickness. The resulting peaks are marked with
arrows in
Figure 6.14
. After the cell division, the daughter cells adhere to the Petri dish.
This is accompanied with a decrease in
Δϕ
cell,max
. For cell C that undergoes no cell
division, only few fluctuations of phase contrast and cell thickness are observed.
Figure 6.15
shows the automated obtained cell migration
x
,
y
trajectories for all evaluated
cells and demonstrates the reliability of the applied cell tracking algorithm.
Figures 6.12
6.14
show the ability of DHM for dynamic cell division monitoring by
simultaneous cell thickness measurement and 2D cell tracking. The mitosis is clearly
detected by the phase contrast images and by the temporal dependency of phase contrast
and cell thickness. However, as slight changes of the integral cellular refractive index
cannot be completely excluded during the cell division process, the obtained values for the
cell thickness shown in
Figure 6.14
have to be handled carefully
[29]
. A further increase of
the measurement accuracy for the cell thickness may be achieved by methods for
simultaneous refractive index determination as, for example, described in Refs.
[70,84]
and
[85]
. As the
x
,
y-
position data in
Figure 6.15
are obtained by the determination of the

Search WWH ::

Custom Search