Biomedical Engineering Reference
In-Depth Information
(A)
(B)
25
25
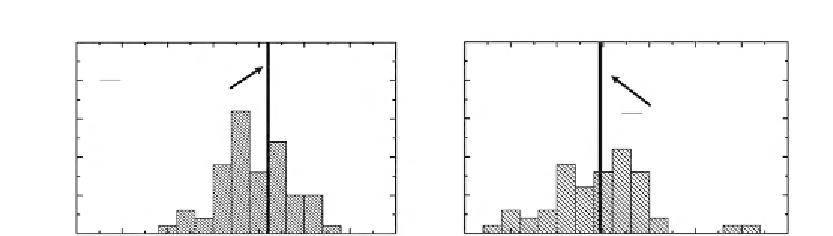
PaTu 8988
HepG2
20
20
n
cell
= 1.375 ± 0.004
15
15
n
cell
= 1.369 ± 0.005
10
10
5
5
1.355 1.360 1.365 1.370 1.375
n
cell
1.355 1.360 1.365 1.370 1.375
n
cell
1.380 1.385 1.390
1.380 1.385 1.390
Figure 6.8
Histogram of the refractive index data for PaTu 8988 XX cells (A) and HepG2 cells (B)
[52]
.
morphology. First, results from the temporal analysis of phase contrast and thickness
changes of endothelial cells due to toxin exposure are presented. Then, the impact of
vacuole formation in cells is illustrated. Finally, taking pancreatic tumor cells as an
example, quantitative phase images of apoptotic and necrotic processes are compared.
6.5.1 Cell Reaction on Chemical Substances
The analysis of cell reactions to chemical substances on individual cells is demonstrated by
a comparative study of HBMECs and umbilical vein endothelial cell-derived EA.hy 926
cells which were exposed to a toxin (Shiga toxin 1: Stx1; for details, see Ref.
[75]
).
Therefore, an iMIC (Till Photonics, Gr¨felfing, Germany) with attached DHM module
based on a fiber optic Mach
Zehnder interferometer as shown in
Figure 6.1
(for illustration
see Ref.
[76]
) was used. An incubator was used for stabilized temperature. The coherent
light source for the recording of digital holograms was a frequency-doubled Nd:YAG laser
(
λ
5
532 nm). The cells were investigated in Petri dishes and exposed to 500 ng/ml of Stx1
at 37
C. Digital off-axis holograms of single cells were recorded continuously every 3 min.
The reconstruction of the quantitative phase images from the digitally captured holograms
was performed as described in
Section 6.3
.
Figure 6.9
shows different time courses of Stx1-induced cell death of a single HBMEC and
an EA.hy cell by dynamic changes of the cells' shape and thickness after exposure to Stx1.
The results shown are representative data of the three independent single-cell analyses
which were performed for each cell type.
Figure 6.9A
shows false color-coded DHM phase
contrast images of cells at indicated time after Stx1 addition. In
Figure 6.9B
, cross-sections
through the quantitative DHM phase images along the lines in panel (A) are depicted. The
parameters
and
d
denote the phase contrast in radian and corresponding cell thickness
calculated by
Eq. 6.4
, respectively, for a cellular refractive index of
n
cell
5
1.37
Δϕ
Search WWH ::

Custom Search