Environmental Engineering Reference
In-Depth Information
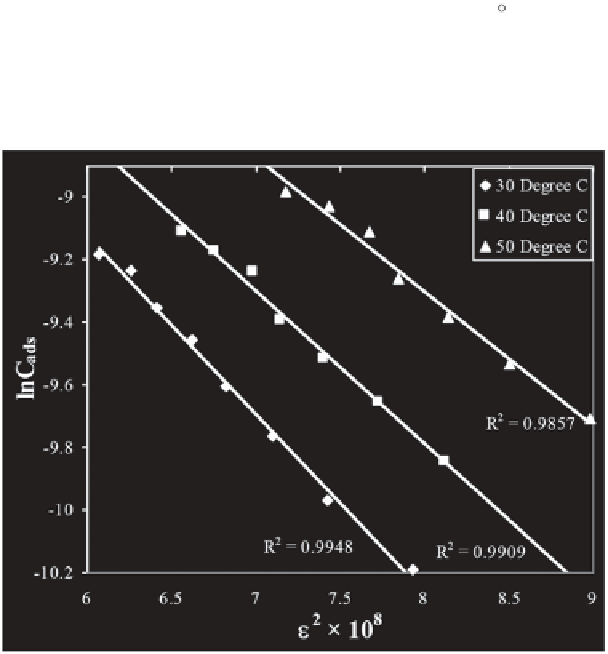
11.5.3.4
Dubinin-Radushkevich (D-R) Isotherm Model
To verify the applicability of the D-R isotherm model graphs between
lnC
ads
against
2
are plotted for the adsorption of Azo dyes over Hen
Feathers (Figures 11.14 and 11.15) at 30, 40 and 50 C. As evident from the
graphs, the values of regression coefficients of the obtained straight line are
found close to unity in all cases, thereby indicating the applicability of D-R
adsorption isotherm at all the temperatures.
The slopes of straight-lines of the graphs between lnC
ads
against
2
give
activity coefficient (β) and intercept yields adsorption capacity (X
m
) of the
adsorption systems. The values of activity coefficient (β) are presented in
Table 11.3. It is clear from the data that for both the dye-adsorbent systems
the value of activity coefficient is found to the tune of 10
-9
mol
2
J
-2
and
remains almost constant at all the temperatures.
Table 11.3 also presents the values of mean sorption energy (E) for the
adsorption of Azo dyes over Hen Feathers at 30, 40 and 50 C. It is interest-
ing to note that for both the systems the values of mean sorption energy
(E) are found between 8 to 16 kJ/mole at all the temperatures, which clearly
indicates that chemisorption operates in the case of Azo dyes adsorption.
Figure 11.14
D-R adsorption isotherm for Amaranth (pH = 2.0) - Hen Feather
(0.01 g/25mL) system at different temperatures.


Search WWH ::

Custom Search