Graphics Reference
In-Depth Information
We will take a closer look at vector and raster map layers shortly. Before we do this,
though, we need to learn how geospatial data (both vector and raster data) is positioned on
a map.
Coordinate reference systems
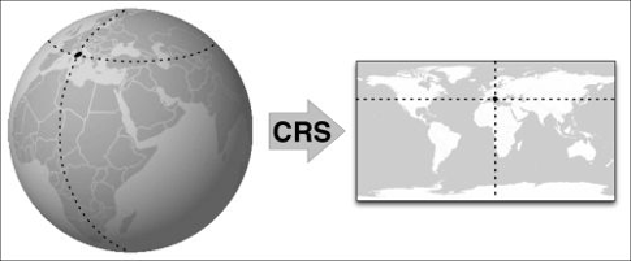
Since the Earth is a three-dimensional object, while maps represent the Earth's surface as a
two-dimensional plane, there has to be a way of translating from points on the Earth's sur-
face into (x,y) coordinates within a map. This is done using a
Coordinate Reference Sys-
tem
(
CRS
):
Globe image courtesy Wikimedia (
http://commons.wikimedia.org/wiki/
A CRS has two parts: an
ellipsoid
, which is a mathematical model of the Earth's surface,
and a
projection
, which is a formula that converts points on the surface of the spheroid
into (x,y) coordinates on a map.
Fortunately, most of the time you can simply select the appropriate CRS that matches the
CRS of the data you are using. However, because many different coordinate reference sys-
tems have been devised over the years, it is vital that you use the correct CRS when plot-
ting your geospatial data. If you don't do this, your features will be displayed in the wrong
place or have the wrong shape.
The majority of geospatial data available today uses the
EPSG 4326
coordinate reference
system (sometimes also referred to as WGS84). This CRS defines coordinates as latitude