Graphics Reference
In-Depth Information
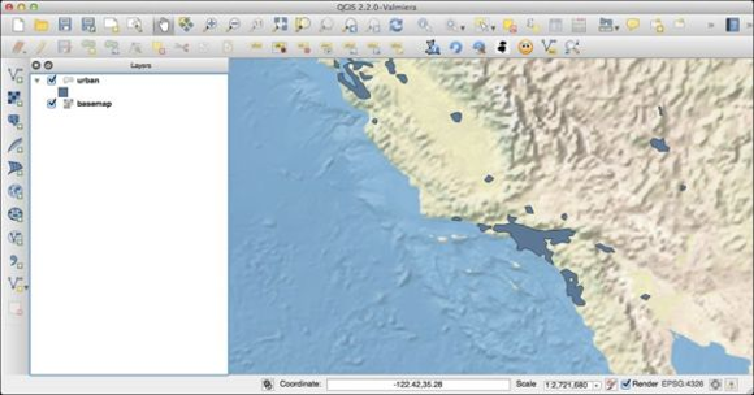
iface.mapCanvas().setExtent(QgsRectangle(-125, 31, -113,
38))
iface.mapCanvas().refresh()
This will zoom in on the map in so that an area of California, including Los Angeles and
the southern part of San Francisco, is now shown on the map:
Finally, let's add our river and lake data to our project. To do this, enter the following into
the Python Console:
layer3 = iface.addVectorLayer("/path/to/
ne_50m_rivers_lake_centerlines/
ne_50m_rivers_lake_centerlines.shp", "water", "ogr")
If you look at the map, you'll see that the rivers and lakes are now visible. However, they
are drawn in a default green color. Let's change this so that the water is now blue:
from PyQt4.QtGui import QColor
layer3.rendererV2().symbols()[0].setColor(QColor("#4040FF"))
iface.mapCanvas().refresh()