Geography Reference
In-Depth Information
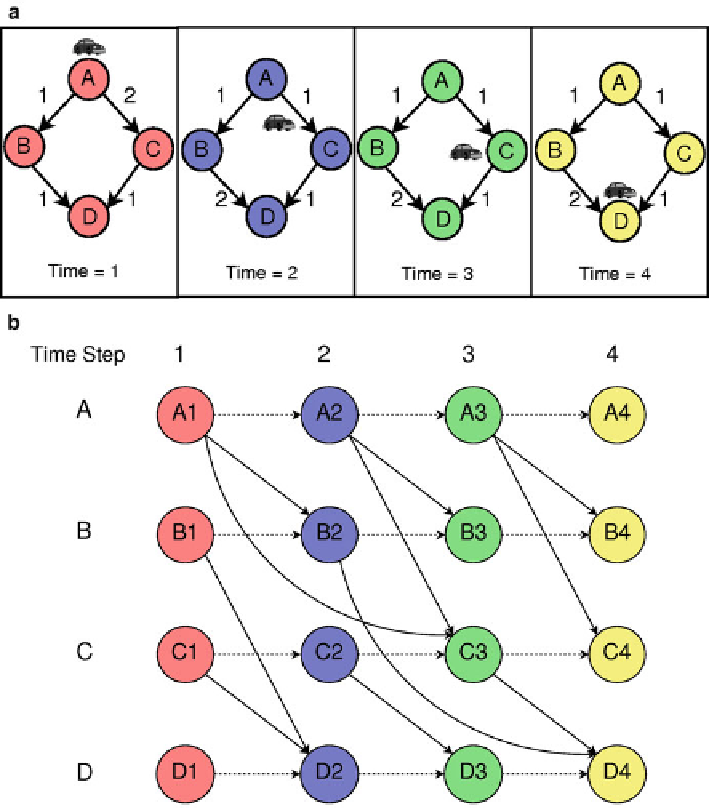
Fig. 6.3
Two representations of spatio-temporal graphs. (Colors encode time steps). (
a
) Snapshot
model of a spatio-temporal graph. (
b
) Time-expanded graph (Color figure online)
and A4, respectively) in Fig.
6.3
b. Edge AC in Fig.
6.3
a is represented as a set of
edges (i.e., A1-C3, A2-C3, A3-C4, :::)inFig.
6.3
b, encoding the time-series of
travel-times. A1-C3 indicates that the travel time for edge AC is 2 at start-time 1.
Similarly, A2-C3 indicates a travel-time of 1 for start-time 2.
Unlike snapshot graphs, time-expanded graphs model the actual travel time
experience of a moving object. For example, when traveling from node A to node
D via node B starting at time
D
1, the object will reach node B at time
D
2, since
edge A-B has a travel-time of 1 at start-time
D
1. The object will reach node D
at time
D
4, since travel-time for edge B-D is 2 at time
D
2. Thus, the total travel
Search WWH ::

Custom Search