Geography Reference
In-Depth Information
at different locations in the fifth time interval across 2 days. This could be due to
detours or traffic conditions that caused the individual to be ahead or behind the
locations at this time on the previous days. Comparison can also be made using
distances between adjacent locations on the same track on different days but in
the same time intervals to determine changes in travel speeds from day to day
(Fig.
20.11
b). Furthermore, daily groupings of strings of consecutive Geohash codes
(like the horizontal groupings in the shaded boxes in Fig.
20.11
b) reveal the daily
patterns of stops in common locations. In this illustrative example, the individual
stayed (long stops) at
9y69gmob
in the morning and returned to the same location
at night on Day
1
and Day
n
, but the person stayed at the location all day on Day
2
,
which suggested that the location is likely to be the individual's residence.
In addition, differences in space and time across tracks as shown in separate line
graphs in Fig.
20.11
a can be converted to a space-time-track image with a brighter
shade indicating a greater difference along tracks (Fig.
20.12
). In a space-time-track
image, each row corresponds to a track, and each column represents resampled time
intervals along these tracks. The lighter a cell denotes a smaller spatial difference
of this track from the previous track. Measures of spatial difference can be based on
Euclidean distance, travel distance, or some other cost metrics. If the track taken on
Day
i
is identical to the track taken on Day
i
1
, the row for Day
i
in the image will
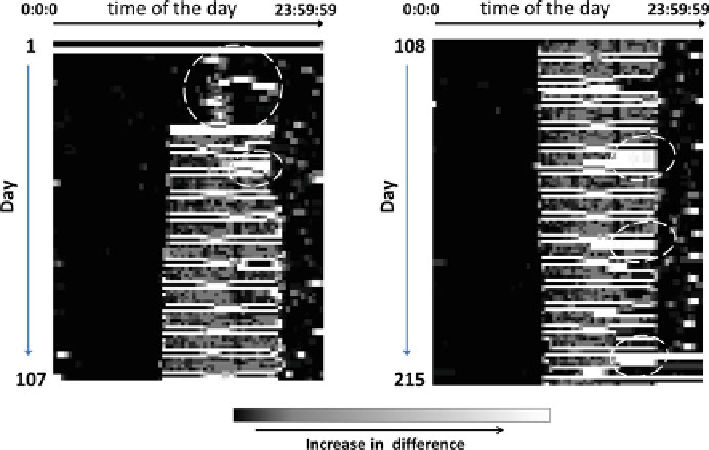
Fig. 20.12
A space-time-track image showing spatial differences in daily track comparison. The
difference is determined for each time interval by the spatial difference of a track to that of the
previous day. The
circles
mark examples that may suggest incongruent patterns or new activities
Search WWH ::

Custom Search