Geography Reference
In-Depth Information
In addition, interoperability can also be an obstacle for analyses involving
multiple data resources and multiple functions. This problem surfaces up when we
perform analysis of evaluating simulation quality which may involve observation
and simulation data in different formats.
18.5
Big Data Visualization
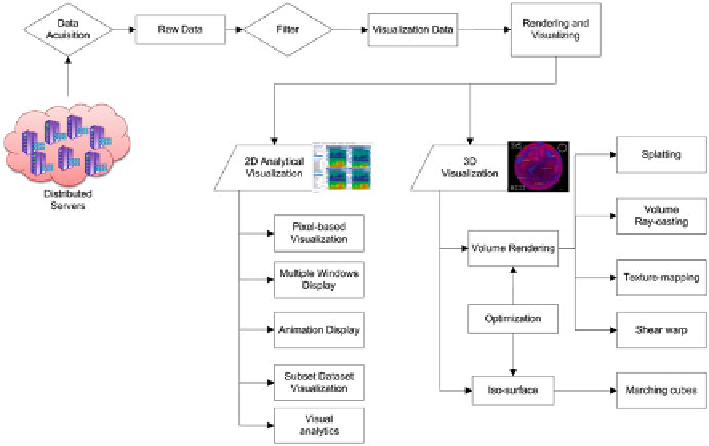
Data visualization aims to convert data and information/pattern derived from the
data into graphical representations to be easily understood by the users. The visu-
alization pipeline consists of three main parts (Fig.
18.5
): (1) Data acquisition is to
quickly access the raw data from distributed storage before visualizing; (2) Filtering
process is to extract the visualization data from raw data that can't be directly used
to visualize in both 2D and 3D; (3) Rendering and visualization are categorized
into two main parts: 2D analytical visualization and 3D analytical visualization. In
2D visualization, five visualizing components are needed and include pixel-based
visualization, multiple window display, animation display, subset dataset display
and visual analytics. In 3D visualization, volume rendering and iso-surfaces are
most regular rendering algorithms used for 3D visualization (Levoy
1988
; Robert
et al.
1988a
,
b
). In addition, there are many optimizations in the two algorithms for
speeding up the rendering performance and improving the capability of real-time
rendering.
Fig. 18.5
Visualization pipe
Search WWH ::

Custom Search