Geography Reference
In-Depth Information
a
43.7
0.9
0.8
0.7
22.2
0.6
0.5
0.7
0.4
0.3
0.2
−20.7
0.1
0
−42.2
−0.1
−24.6
−2.6
19.4
41.4
64.4
Longitude
b
0.8
0.7
0.6
0.5
0.4
0.3
0.2
0.1
0
NA
11.3
16.8
22.2
27.6
33.0
Latitude
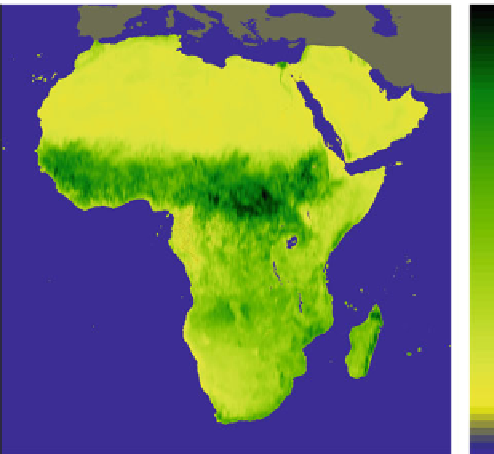
Fig. 17.3
Spatial path data (
a
) Vegetation cover in Africa (
b
) Value observed along a longitudinal
path
non-spatial features such as population in each region may be associated with each
of the polygons. For example, Fig.
17.2
c shows an example of global GDP growth
data where each polygon represents a country and the color code represents the GDP
growth of each country in 2011 (CIA
2013
).


Search WWH ::

Custom Search