Geography Reference
In-Depth Information
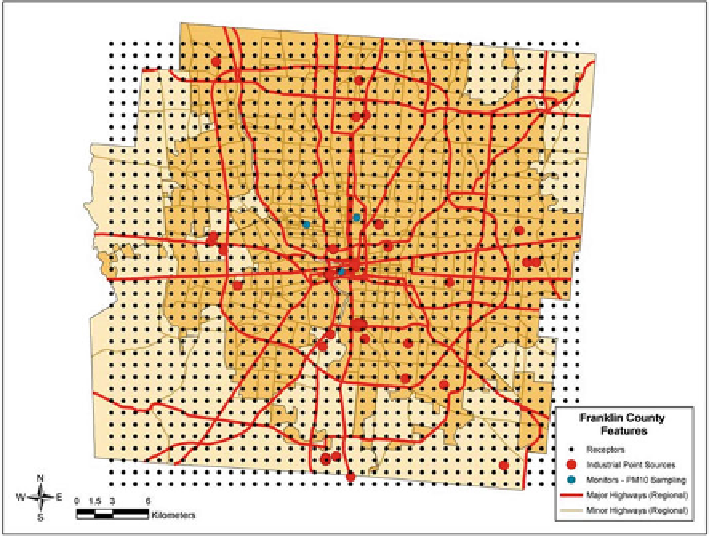
Fig. 16.2
The 1,520 receptor locations used in the dispersion modeling
Based on this conceptualization and implementation of the dispersion process,
pollution concentrations were estimated for every hour at every receptor location for
eight selected days in March, April and May of 1999: March 2nd, 4th, 5th; April 5th,
7th, 9th; May 6th, 7th. These days were selected to coincide with the survey days of
the activity-travel diary dataset used in the study, and this allows for an analysis of
24-h particulate matter exposure for survey participants. Receptor locations are user-
defined sites at which the model will estimate concentration values from multiple
pollution sources. For this study, a 38 by 40 uniform grid with one kilometer of
separation between each receptor was used - thus creating 1,520 receptor locations
to cover the extent of Franklin County (Fig.
16.2
).
Based on data of the 119 industrial point sources, pollution concentration
estimates were generated by the dispersion model for the 1,520 receptor locations
for a total of 192 h (8 days
24 h). Using these concentration values and the kriging
method, 192 surfaces of particulate matter concentrations were then created. These
surfaces were then used to assess individual exposure for selected participants in
the activity-travel diary survey. Maps generated by the air dispersion model indicate
that certain hot spots with elevated levels of particulate matter exist across Franklin
County (Fig.
16.3
). These areas of high pollution concentrations are located mainly
in the southeast of downtown Columbus and around the intersection of two major
Search WWH ::

Custom Search