Geography Reference
In-Depth Information
Fig. 12.4
A network time
prism: the space-time prism
in network space (Kuijpers
and Othman
2009
)
n
.x; y/
ˇ
ˇ
ˇ
t
o
t
RN
.x; y/ ;
x
j
;y
j
t
j
p
j
.t /
D
(12.10)
n
.x; y/
ˇ
ˇ
ˇ
t
i
t
s
o
(12.11)
t
RN
..x
i
;y
i
/ ; .x; y//
C
t
RN
.x; y/ ;
x
j
;y
j
t
j
g
ij
D
where
t
RN
((
x
i
,
y
i
), (
x
,
y
)) and
t
RN
((
x
,
y
), (
x
j
,
y
j
)) denote the minimum travel time
from location (
x
,
y
) to the origin (
x
i
,
y
i
) and the destination (
x
j
,
y
j
), respectively,
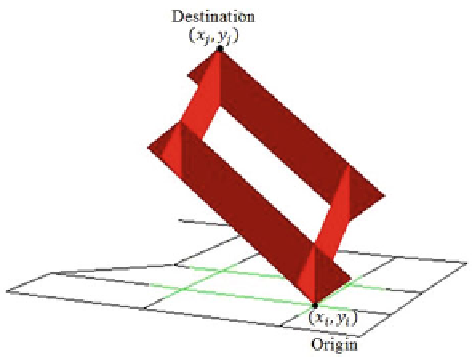
within the network. Figure
12.4
illustrates a network time prism: the green arcs
comprise the prism's spatial footprint (Eq.
12.11
) and the red region is the full
NTP whose boundary can be defined by the earliest arrival time
t
min
and the latest
departure time
t
max
at each accessible location (
x
,
y
) along green arcs:
t
min
D
t
i
C
t
RN
..x
i
;y
i
/ ; .x; y//
(12.12)
t
RN
.x; y/ ;
x
j
;y
j
t
max
D
t
j
(12.13)
Based on the prism analytics in planar and network space discussed above, sub-
stantial progress have been made on techniques for calculating realistic prisms based
on high-resolution mobility, transportation and other geographic data (e.g. Kuijpers
and Othman
2009
; Miller
1991
; Miller and Bridwell
2009
; Neutens et. al.
2007
;
O'Sullivan, Morrison and Shearer
2000
; Wu and Miller
2001
). In addition, path
and prism concepts have been extended from the physical world to the virtual
worldimpliedby
information and communication technologies
(ICT) (Couclelis
2009
; Miller
2005b
;YuandShaw
2008
). However, researchers have focused on
the prism boundary as an indicator of the limits on an individual's mobility and
accessibility, and ignored the properties of the prism's interior that relate to the
individual's potential movements. Only recently has the interior structure of prism
Search WWH ::

Custom Search