Geography Reference
In-Depth Information
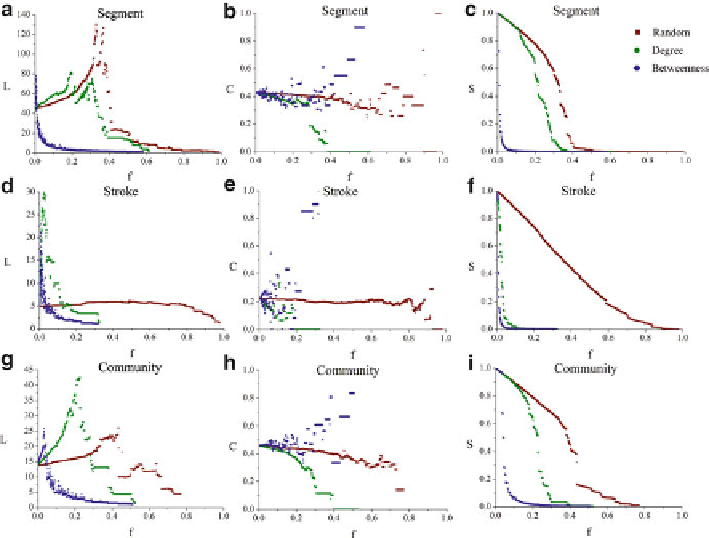
Fig. 8.6
Network changes under attacks
network represented as a segment-based network. Figure
8.6
d-f show changes of
the network represented as stroke-based network. And Fig.
8.6
g-i show changes of
the network represented as a community-based network. In each sub graph, three
types of points stand for the changes under different attack strategies. Red cubes
show the changes of network under random attacks while the green circles show
the changes of network under degree-based attacks and blue diamonds show the
changes of network under betweenness-based attacks.
Although represented as three dual graphs with multiple granularities, the reac-
tion of the network under attacks are similar. The changes of network performances
under successive attacks can all be divided into three stages. In the first stage,
the removal of target single nodes and some small isolated components caused
by node removal slowly decreased the size of the largest component. At this
stage,
L
increases, whereas
C
slightly decreases. This finding indicates that at the
beginning of the attack procedure, network efficiency, including both global and
local efficiency, slowly decreases. In the second stage, major changes in network
structure occur. The abrupt decrease in
S
shows that the network split into several
components with similar sizes. At this stage,
L
begins to drop sharply. However,
the decrease of
L
does not indicate the increase of global efficiency because the
size of the giant component dramatically decreases. Thus after the first stage,
Search WWH ::

Custom Search