Hardware Reference
In-Depth Information
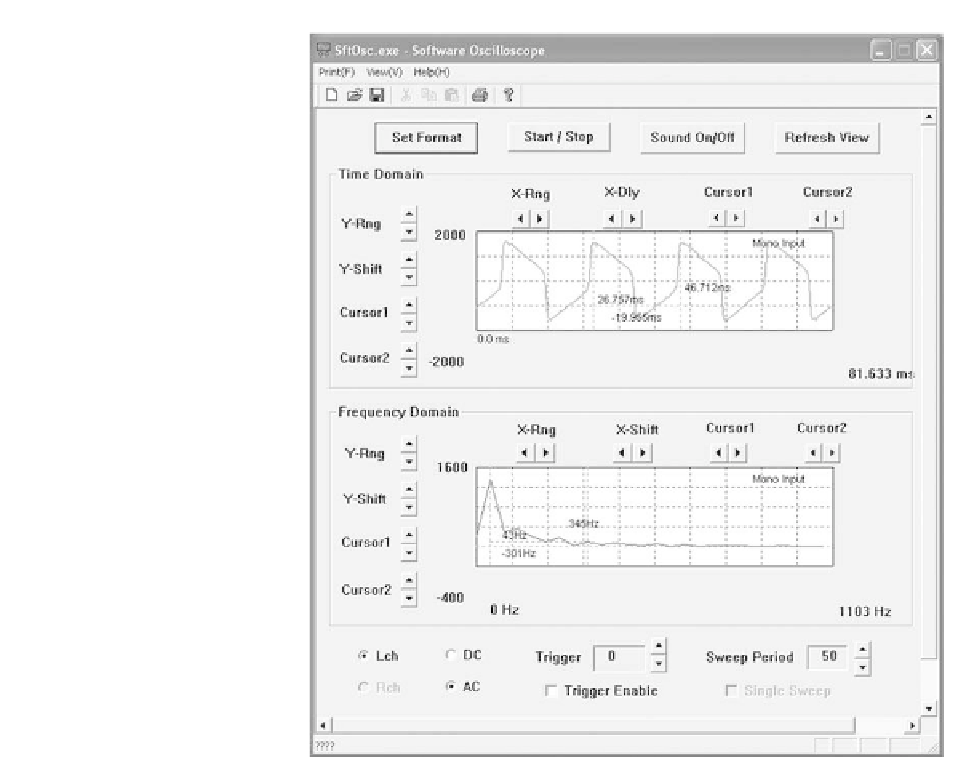
Figure 11.24
Use of cursors for precise parameter measurement of a
repetitive waveform using Software Oscilloscope
also be used in conjunction with Software Oscilloscope's frequency domain
display (as shown in Figure 11.24).
A further example is shown in Figure 11.25. Here the parameters of a pulse
are being accurately measured. The pulse width is found to be 1.596 ms (i.e.
2
.
249
−
0
.
653 ms) and its peak-peak value is 9400 mV (i.e. 7000-(
−
2400 mV)).
Spectrum analysis
The technique of Fast Fourier Transformation (FFT) makes it possible to pro-
duce frequency spectrum displays. Such displays can be to investigate the
harmonic content of waveforms as well as the relationship between several
signals within a composite waveform.
Figure 11.26 shows the frequency spectrum for the sine wave shown previ-
ously in Figure 11.18. It should be noted that the sine wave is extremely pure
with only one single-frequency component evident.