Hardware Reference
In-Depth Information
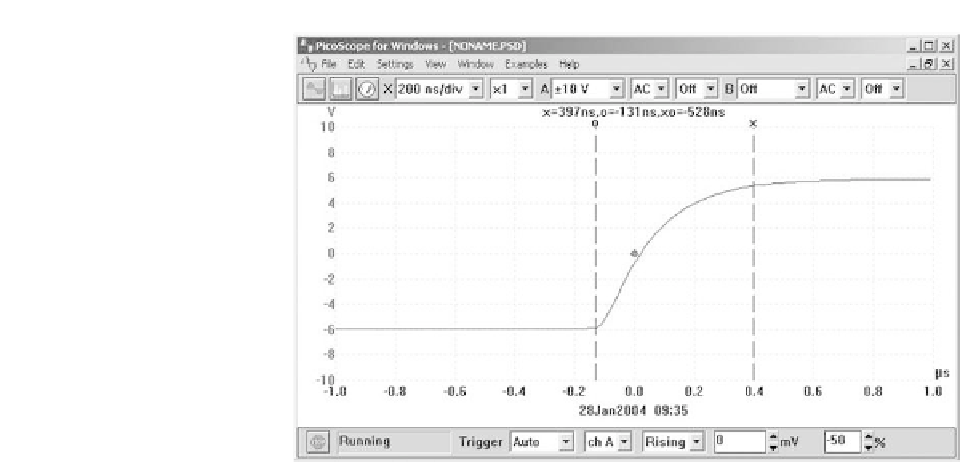
Figure 11.9
The addition of a second time cursor makes it possible to
measure the time accurately between two events. Here event 'o' occurs 131 ns
before the trigger point whilst event 'x' occurs 397 ns after the trigger point.
The elapsed time between these two events is 528 ns. The two cursors can be
adjusted by means of the mouse (or other pointing device) or, more accurately,
using the PC's cursor keys
in order to display the leading edge of a fast pulse. By manipulating the cursors
it is possible to accurately determine the rise time of the pulse as well as the
overshoot, undershoot, and damping factor.
Further cursors can be added in order to determine the difference between
two discrete events or points on a continuous waveform. In the example shown
in Figure 11.9, the addition of a second time cursor has allowed us to make
an accurate measurement of the elapsed time between the start of a pulse and
the 95% point. The start of the pulse has occurred 131 ns before the trigger
point whilst the 95% point has been reached 397 ns after the trigger point. The
time difference between these two events has been calculated and displayed as
520 ns.
Spectrum analysis
The technique of Fast Fourier Transformation (FFT) calculated using software
algorithms using data captured by a DSO has made it possible to produce
frequency spectrum displays. Such displays can be to investigate the harmonic
content of waveforms as well as the relationship between several signals within
a composite waveform.
Figure 11.10 shows the frequency spectrum of a 1 kHz square wave derived
from a low-cost waveform generator. The DSO has been set to capture data at
a rate of 256 samples per second over the frequency range DC to 12.2 kHz. As
expected, the odd harmonics (3, 5, 7 kHz, and so on) are present at amplitudes
that decay progressively with harmonic order. The display indicates that the