Hardware Reference
In-Depth Information
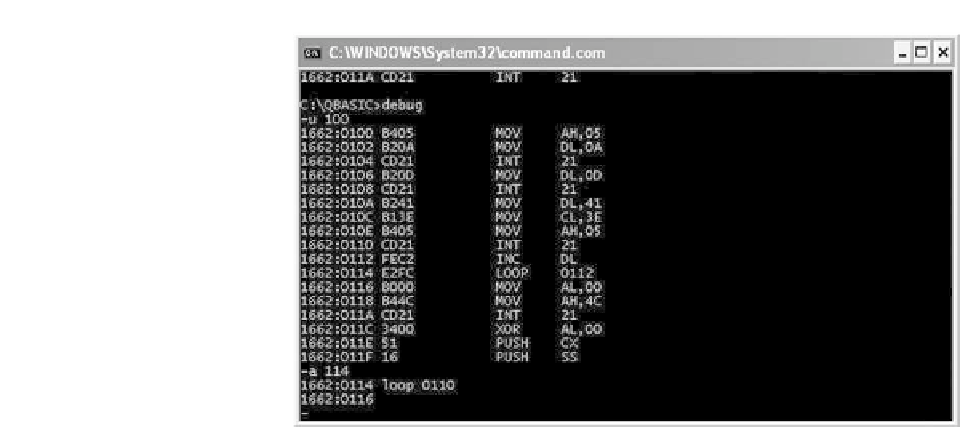
Figure 3.4
A typical Debug session
Using DEBUG
One of the most powerful (but all too often neglected) tools available within
the DOS environment is the debugger, DEBUG.COM or DEBUG.EXE. This
program provides a variety of facilities including single stepping a program
to permit examination of the processor's registers and the contents of memory
after execution of each instruction. On most modern Windows installations,
DEBUG.EXE can be found in the System32 folder of the Windows directory.
The Debug command line can accept several arguments. Its syntax is as
follows:
DEBUG [filespec] [parm1] [parm2]
where
[filespec]
is the specification of the file to be loaded into memory,
[parm1]
and
[parm2]
are optional parameters for the specified file.
As an example, the following MS-DOS command will load debug along with
the file MYPROG.COM (taken from the disk in drive A:) ready for debugging:
DEBUG A:
\
MYPROG.COM
When debug has been loaded, the familiar MS-DOS prompt is replaced by a
hyphen (-). This indicates that DEBUG is awaiting a command from the user.
Commands comprise single letter (in either upper or lower case). Delimiters
are optional between commands and parameters. They must, however, be used
to separate adjacent hexadecimal values.
<CTRL-BREAK>
can be use to abort a DEBUG command whilst
<CTRL-NUM.LOCK>
can be used to pause the display (any other keystroke restarts
the output). Commands may be edited using the keys available for normal
MS-DOS command editing.
All Debug commands accept parameters (except the
Q
command). You can
separate parameters with commas or spaces, but these separators are required
only between two hexadecimal values. Therefore the following commands are
equivalent:

