Information Technology Reference
In-Depth Information
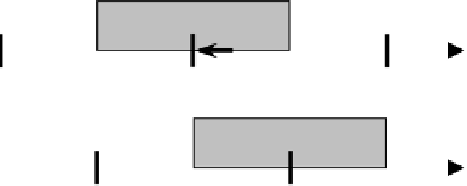
Assume that two quantizers with the same quantization step ∆ are used in the em-
bedding. For maximum robustness, the minimum distance between reconstruction
positions should be ∆/2 as shown in Fig. 4. In the figure, thick vertical bars indicate
quantized values after embedding. With quantizer 0, for example, if a QIM modified
coefficient is
A
, the original coefficient value
x
∈ [
A
−∆/2,
A
+∆/2]. With quantizer 1,
x
is quantized to
A
+∆/2. The average error caused by QIM embedding is
∆
A
A
+
∆
∆
/
2
∫
,
|
x
−
A
|
=
|
x
−
A
|
p
(
x
)
dx
=
(4)
x
4
−
/
2
where
p
x
(
x
)=1/∆ since quantization error obeys a uniform distribution.
To remove the embedded data, one can “restore” the modified histogram by dither-
ing. Each quantized coefficient is modified with a random number uniformly distrib-
uted in [−∆/2, +∆/2] as shown by the shaded regions in Fig. 4. Thus an original coef-
ficient
x
/2,
A
+∆/2] or [
A
,
A
+∆] depending on the quantizer used. The average error in
y
with
respect to the original
x
is
∈
[
A
,
A
+∆
/2] is now moved to
y
that may locate anywhere within [
A
−∆
2
∆
∆
/
2
∆
∆
/
2
∫
∫
|
y
−
x
|
=
|
y
−
x
|
p
(
y
)
dy
dx
=
,
(5)
y
∆
0
−
/
2
3
where
p
y
(
y
)=1/∆.
Quantizer 0
A
−∆
x
A
+∆
A
Quantizer 1
x
A
−∆/2
A
A
+∆/2
Fig. 4.
Removal of QIM watermark with dithering. The thick vertical bars indicate the quantiz-
ers' reconstruction values. The shaded regions represent the range of dithering
Another method is to modify the watermarked coefficients by adding ±∆/4+β,
where
/4, as shown
in Fig. 5. In this case, the watermark can no longer be detected, but the histogram of
DCT coefficients remains discrete. The average error of the resultant coefficients are:
β
is a uniformly-distributed random variable much smaller than
∆
2
1
∆
1
∆
5
∆
/
2
∫
|
y
−
x
|
=
x
−
+
x
+
dx
=
∆
,
(6)
∆
2
4
2
4
16
0
which is slightly better than the continuous dithering technique.