Information Technology Reference
In-Depth Information
within each file. For the invariant induction, a threshold setting of 1.96
s
, where
s
is
the standard deviation of the residual error, was chosen. Since we were focusing on
the induction of linear equations in these experiments, this technique could only indi-
cate whether there was an error in a line (represented by two readings) and it could
not identify individual points in a file that were corrupt. It was also found that the
relationship between the reactive power readings was non-linear and so errors could
not be identified in these values. This meant that a maximum of eleven line errors
could be detected by invariant induction; whereas the n-gram technique could theo-
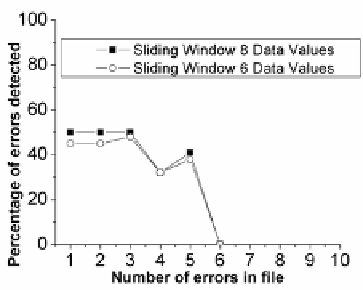
retically detect up to forty four corruptions in the file. Results are shown in Fig. 7 and
Fig. 8.
Fig. 7.
Plot of the number of errors in the data
against the average number of errors accu-
rately detected by the n-gram technique
Fig. 8.
Plot of the number of errors per line
against the average number of line errors
accurately detected by invariant induction
8
Discussion
Both techniques performed well in the first experiment. A sliding window that in-
cluded six data readings
7
and an approximation level of two could identify ninety
eight percent of the corrupt files with a one percent false positive rate. With a stan-
dard deviation of two, the invariant induction technique identified ninety one percent
of the corrupt files with a four percent false positive rate.
In the second experiment, the n-gram technique proved to be good at accurately
identifying small numbers of errors within each file, but as the errors increased the
false positive rates started to make the results meaningless
8
. In practice it will proba-
bly be sufficient to identify one or two errors in each file or to identify the file as
completely corrupt and for this the n-gram technique is sufficient. Invariant induction
7
Here again we encounter the magic number six, which has been the optimal window length
in many anomaly-detecting experiments. Tan and Maxion [19] claim that the frequent occur-
rence of this number is an artifact of Forrest's data, but this cannot be the explanation here.
The coincidence is also not as close as it appears. Although six data readings proved optimal,
with four characters in each reading, the actual window length was 24 characters.
8
Results were plotted up to a false positive rate of 20%.