Information Technology Reference
In-Depth Information
7
Results
The first set of experiments measured the true and false positive rates
per file
for the
two techniques, which were used to identify whether a complete snapshot of the net-
work was normal or abnormal. Different sliding window lengths were used for the n-
gram technique and different threshold settings for the invariant induction. The results
are shown in figures 3, 4, 5 and 6.
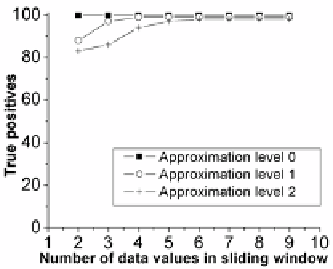
Fig. 3.
The average true positive rates for the
n-gram technique plotted against the number
of power readings in the sliding window
6
using three different approximation levels
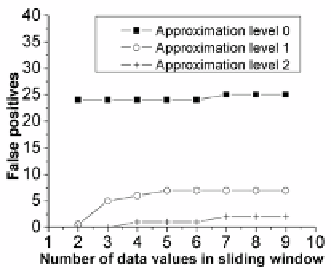
Fig. 4.
The average false positive rates for the
n-gram technique plotted against the number
of power readings in the sliding window using
three different approximation levels
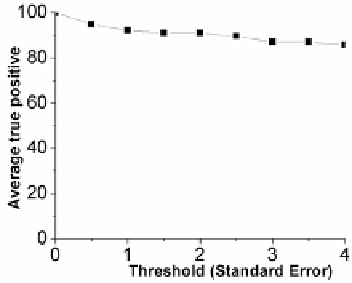
Fig. 5.
True positive rate for invariant induc-
tion plotted against the multiple of the stan-
dard error used to trigger an anomaly
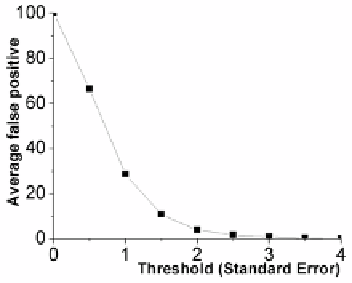
Fig. 6.
False positive rate for invariant induc-
tion plotted against the multiple of the stan-
dard error used to trigger an anomaly
The next set of experiments measured the ability of the two techniques to correctly
identify errors
within
each corrupted file. For the n-gram technique, the sliding win-
dows that covered six and eight data readings gave the best results when identifying
errors on a file by file basis and so these window lengths were used to identify errors
6
Four characters from each power reading were read into the n-gram model and so a sliding
window that includes eight power readings will have a length of thirty two characters.