Geology Reference
In-Depth Information
◗
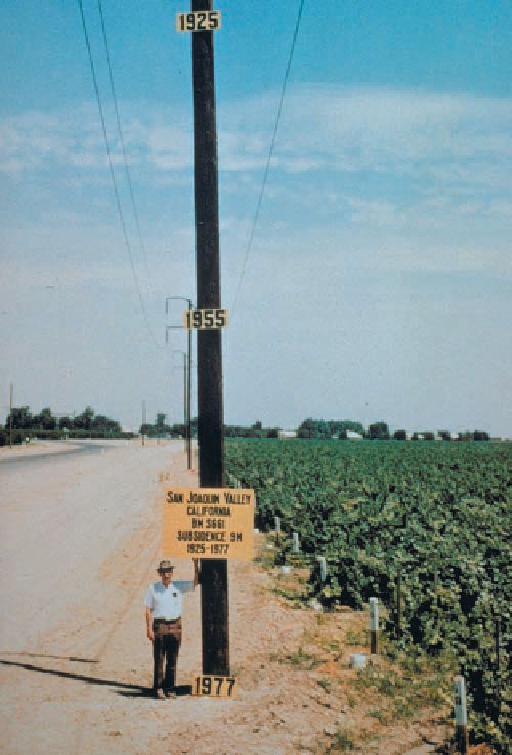
Figure 13.15
Subsidence in the San Joaquin Valley, California
The dates on this power pole dramatically illustrate the amount
of subsidence in the San Joaquin Valley, California. Because of
groundwater withdrawals and subsequent sediment compaction, the
ground subsided nearly 9 m between 1925 and 1977. For a time,
surface water use reduced subsidence, but during the drought of
1987 to 1992, it started again as more groundwater was withdrawn.
◗
Figure 13.16
The Leaning Tower of Pisa, Italy The tilting is
partly the result of subsidence due to the removal of groundwater.
Strict control of groundwater withdrawal, recent stabilization of the
foundation, and renovation of the structure itself have ensured that
the Leaning Tower will continue leaning for many more centuries.
TABLE 13.2
Subsidence of Cities and Regions Due Primarily to Groundwater Removal
Location
Maximum Subsidence (m)
Area Affected (km
2
)
Mexico City, Mexico
8.0
25
Long Beach and Los Angeles, California
9.0
50
Taipei Basin, Taiwan
1.0
100
Shanghai, China
2.6
121
Venice, Italy
0.2
150
New Orleans, Louisiana
2.0
175
London, England
0.3
295
Las Vegas, Nevada
8.5
500
Santa Clara Valley, California
4.0
600
Bangkok, Thailand
1.0
800
Osaka and Tokyo, Japan
4.0
3,000
San Joaquin Valley, California
9.0
9,000
Houston, Texas
2.7
12,100
Source:
Data from R. Dolan and H. G. Goodell, “Sinking Cities,” American Scientist 74 (1986): 38-47; and J. Whittow
, Disasters: The Anatomy of Environmen-
tal Hazards
(Athens: University of Georgia Press, 1979).

Search WWH ::

Custom Search