Geology Reference
In-Depth Information
◗
Figure 8.9
Determining the Distance from an Earthquake
A schematic seismogram showing
the arrival order and pattern produced
by P-, S-, and L-waves. When an
earthquake occurs, body and surface
waves radiate out from the focus at the
same time. Because P-waves are the
fastest, they arrive at a seismograph
fi rst, followed by S-waves and then by
surface waves, which are the slowest
waves. The difference between the
arrival times of the P- and S-waves is
the P-S time interval; it is a function of
the distance the seismograph station
is from the focus.
a
Body waves
Surface waves
Arrival of
P-wave
Arrival of
S-wave
Arrival of
L-wave
Background
noise
Time
marks
P−S time interval
Time
30
25
20
P-S time
interval
15
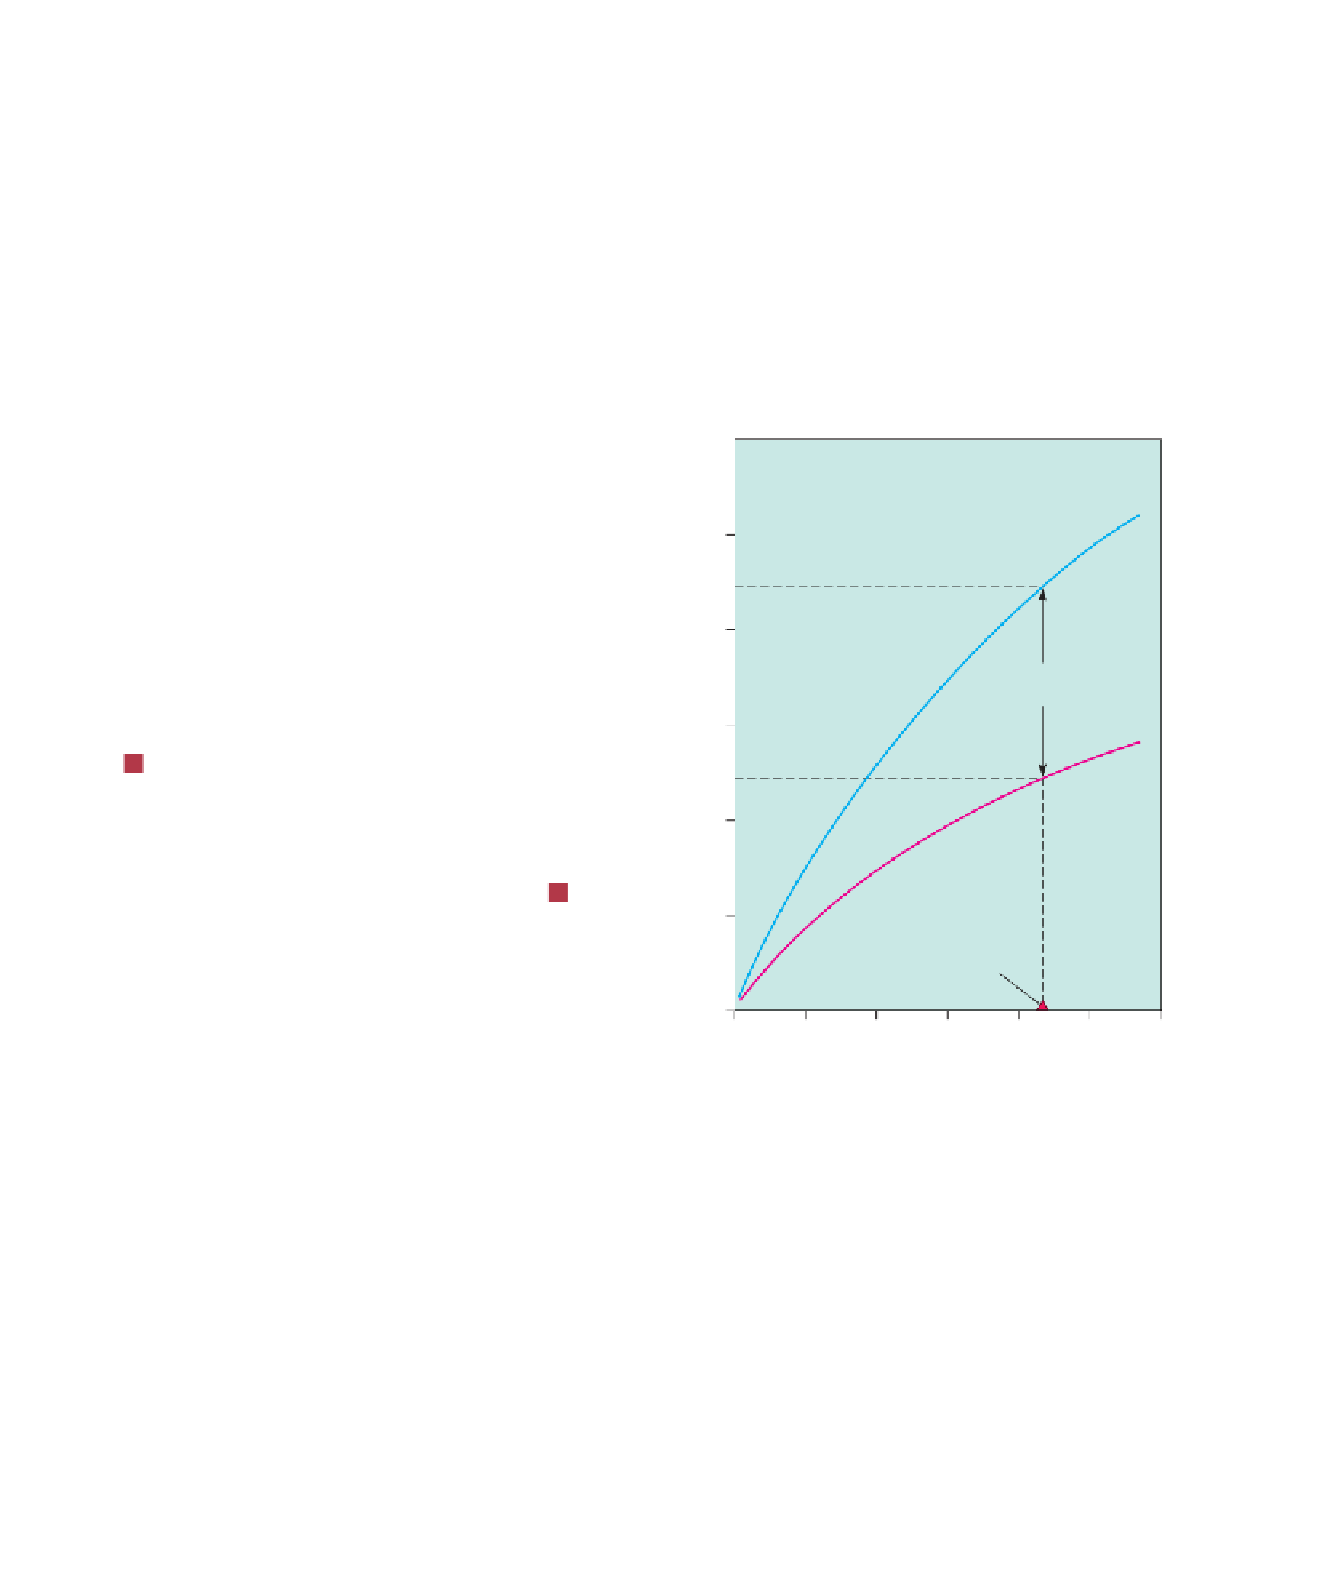
A time-distance graph showing the average travel times for
P- and S-waves. The farther away a seismograph station is from
the focus of an earthquake, the longer the interval between the
arrival of the P- and S-waves, and hence the greater the distance
between the P- and S-wave curves on the time-distance graph as
indicated by the P-S time interval. For example, let's assume the
difference in arrival times between the P- and S-waves in
is 10 minutes (P-S time interval). Using the travel time (minutes)
scale, measure how long 10 minutes is (P-S time interval), and
move that distance between the S-wave curve and the
P-wave curve until the line touches both curves as shown.
Then draw a line straight down to the Distance from focus (km)
scale. That number is the distance the seismograph is from
the earthquake's focus. In this example, the distance is almost
9000 km.
b
10
a
5
Seismograph
0
0
2,000
4,000
6,000
8,000
10,000
12,000
Distance from focus (km)
violence and human suffering are common. Headlines tell us
that thousands died, many more were injured or left home-
less, and property damage is in the millions and possibly bil-
lions of dollars. Few other natural processes account for such
tragic consequences. Although descriptions of fatalities and
damage give some indication of the size of an earthquake,
geologists are interested in more reliable methods for deter-
mining an earthquake's size.
Two measures of an earthquake's strength are com-
monly used. One is
intensity
, a qualitative assessment of the
kinds of damage done by an earthquake. The other,
mag-
nitude
, is a quantitative measure of the amount of energy
released by an earthquake. Each method provides impor-
tant information that can be used to prepare for future
earthquakes.
Intensity
is a subjective or qualitative measure of the kind
of damage done by an earthquake as well as people's reac-
tion to it. Since the mid-19th century, geologists have used
intensity as a rough approximation of the size and strength
of an earthquake. The most common intensity scale used in
the United States is the
Modifi ed Mercalli Intensity Scale
,
which has values ranging from I to XII (Table 8.2).
Intensity maps can be constructed for regions hit by
earthquakes by dividing the affected region into various inten-
sity zones. The intensity value given for each zone is the maxi-
mum intensity that the earthquake produced for that zone.
Even though intensity maps are not precise because of the sub-
jective nature of the measurements, they do provide geologists


Search WWH ::

Custom Search