Java Reference
In-Depth Information
Identifying Performance
Issues with NetBeans Profiler
Sometimes we run into performance problems in some of our applications. At
times, identifying the code to be optimized may be trivial, but sometimes it is
not easy. Profilers are tools that can help us pinpoint performance problems in
our code. NetBeans comes with a very good profiler that we can use with our
Java EE applications.
Profiling Our Application
All we need to do in order to profile our application is right-click on it in the
Projects
window and select
Proile
.
Before we can profile an application, we need to calibrate the NetBeans profiler by
going to
Proile
|
Advanced Commands
|
Run Profiler Calibration
.
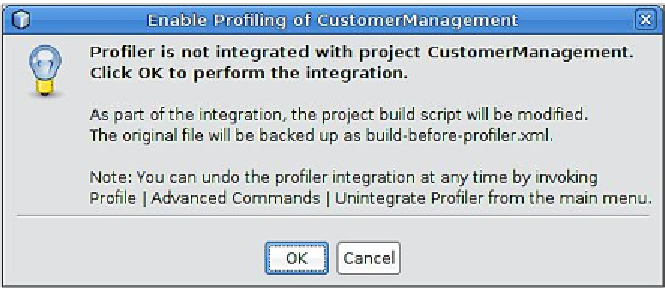
The first time we attempt to profile our application, the following dialog will pop-up: