Geoscience Reference
In-Depth Information
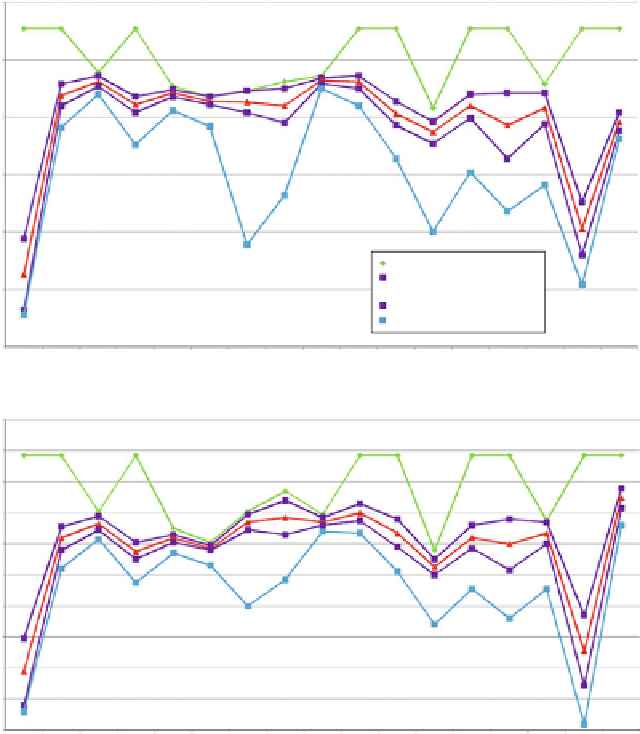
AMSR-E 10.7 H BT Value range for land cover classes on 30/09/2011.
350
300
250
200
150
Maximum BT in Kelvin
Max. BT std. value
Mean BT in Kelvin
Min. BT std. value
Minimum BT in Kelvin
100
50
0123456
Land Cover Classes
789 0 1 2 3 4 5 6
AMSR-E 10.7 V BT Value range for land cover classes on 30/09/2011.
350
330
310
290
270
250
230
210
190
Maximum BT in Kelvin
Max. BT std. value
Mean BT in Kelvin
Min. BT std. value
Minimum BT in Kelvin
170
150
0123456
Land Cover Classes
789 0 1 2 3 4 5 6
Fig. 2 continued
Table
2
shows all 17 land cover classes based on the MPGR graphs. For the
PR
89 GHz) combination, vegetation is present from 0.0 to 0.06,
and then barren/sparse vegetation or bare soil from 0.06 to 0.09, with ice between
0.09 and 0.012 and then water. For the PR
PR (36
18, 10
-
-
-
18)]
combination, vegetation is from 0.0 to 0.04, bare soil from 0.06 to 0.08, and ice
0.09 to 0.12 followed by water. For the GR
GR [18
—
(18
89), 10
—
(10
-
-
-
GR (89
18, 36
10) combination,
-
-
-
dense vegetation is present between
0.03 and 0.0, then normal vegetation, bare
soil between 0.04 and 0.05, then snow/ice from 0.05 to 0.06, and again followed by
water.
−


Search WWH ::

Custom Search