Geoscience Reference
In-Depth Information
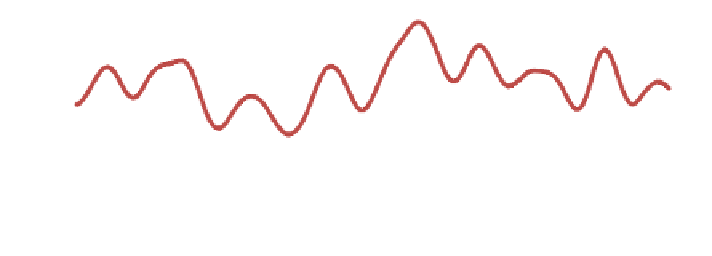
0.15
0.1
0.05
0
-0.05
-0.1
0
3
6
9
12
15
18
Time, s
Fig. 14 Calculated sonar cable length
Here: h
n+1
—
is the current difference of cable
'
1—is length from the starting point,
h
n
—
is the difference of cable
'
s length from starting point that was
fixed before the
time period
ʔ
t. Results are shown in Fig.
14
. The instant changes of the cable
'
s
length
h are calculated according to this Eq. (
19
)
Δ
Þ D
t
2
D
h
¼ D
t
v
n
þ
a
n
þ
a
n
þ
1
ð
ð
19
Þ
For more accurate data collection we can use two or three identical sensors
mounted in the same place. Then some average values can be calculated for a better
accuracy. In order to get better results, different types of sensors could be combined
as well. For constantly changing angle between the axis Z of accelerometer and g-
sensor subtraction the accelerometers can be mounted on the stable sleeve.
7 Conclusion
The biggest in
uence to the side scan sonar high quality images is done by towing
vessel motion disturbances, caused by rough sea waves. Other less important fac-
tors are towing vessel turbulence, sonar distortions during U turns and underwater
currents [
17
]. In this paper a successfully designed and manufactured motion
detection measurement system that detects towing vessel and side scan sonar
motions was tested in real life operations. The side scan sonar prototype control
parameters were estimated and calculations were made. A side scan sonar system
prototype that is suitable for sea
fl
oor imaging in shallow waters was designed. It
uses mechanical stabilization using DC motor and the motion measurement system.
In the future, more experimental data will be collected and additional research will
be conducted to further improve the presented system. Also full a scale heave
motion compensation system with gravitic depressor will be manufactured and
mounted on the research ship. These improvements will increase number of days
per year that sonar system can be used.
fl


Search WWH ::

Custom Search