Geoscience Reference
In-Depth Information
1.5
1
0.5
0
-0.5
-1
-1.5
0
3
6
9
12
15
18
21
Time, s
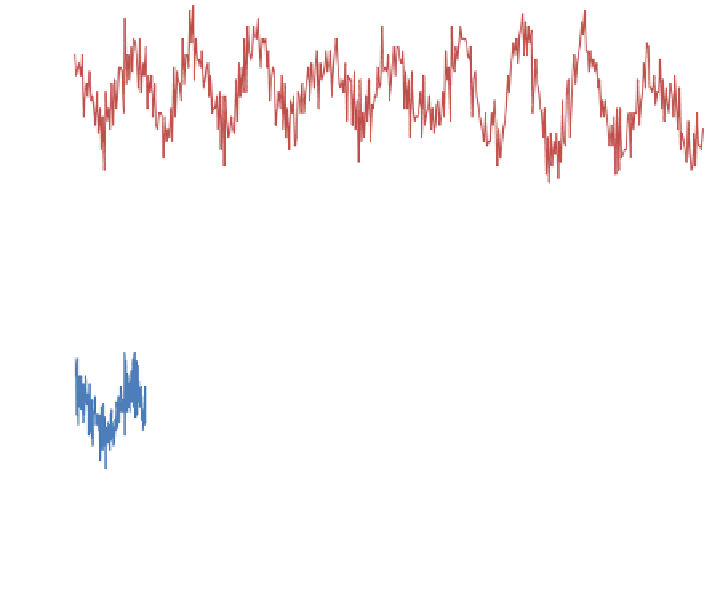
Fig. 10 First test results, data from the Z axis accelerometer
1
0.5
0
-0.5
-1
-1.5
0
3
6
9
12
15
18
Time, s
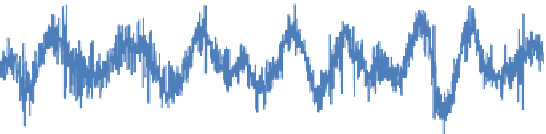
Fig. 11 Second test results, data from the Z axis accelerometer
and other disturbances the collected data of accelerometer. On the other hand, the
parameters of ship movement can be clearly seen. The heaving motion of the ship
rise when the ship swims through the waves is clearly visible. The acceleration of
the ship
fixed with axis Z is presented in Fig.
10
.
The second measurement was performed on the same day. The data acquisition
system worked at 80 Hz frequency and only accelerometer was enables. In this
case, the values scanned with Z axis accelerometer are only relevant. Collected data
is presented in Fig.
11
. It can be seen that the values between each measurement
vary. The collected data was adjusted with a virtual filter proposed by Koseeyaporn
and Koseeyaporn [
16
]. The processed data is presented in Fig.
12
.
6 Calculations Using the Collected Data
Further calculations were made using the data from the second measurement. This
data was not processed with any
filters. Measurements started with the speed of the
vertical
fluctuation of the starting point when its value was 0. Then the modulus of
acceleration was the biggest.
fl


Search WWH ::

Custom Search