Geoscience Reference
In-Depth Information
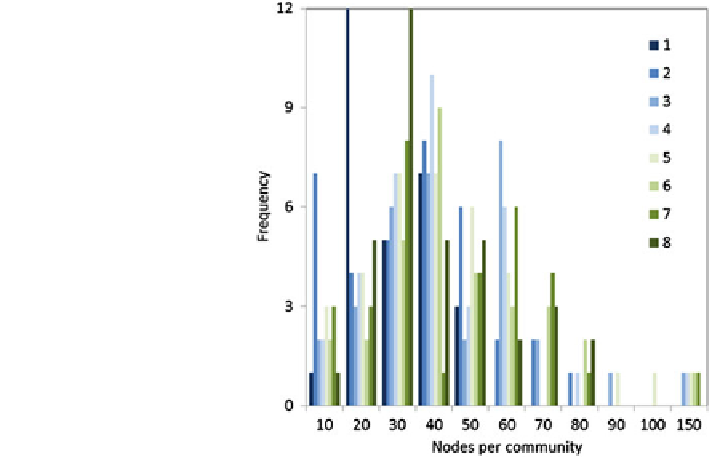
Fig. 3 Size distribution of
network communities
identi
ed in eight time
samples (1
-
8). Source July
09, 2013 public transportation
schedule by Apptives
3 Conclusion
Network approach recently developed in theoretical physics and related disciplines
continuously proves to be a promising direction of research also in case of urban
transportation studies. We use public transport system in a usual European city to
demonstrate that it behaves systematically along the daily cycle in response to
changing demand from inhabitants and
firms in roles of economic actors. Not only
overall scale of this network is modi
ed but also structural composition of network
topology.
Even the most basic description of data available from schedule demonstrates
that daytime rhythm, which we call urban heartbeat, is present in network structure
very clearly. Network consists of smaller communities in times of lowest intensities
of interaction supplied by public service lines and largest communities in times of
highest intensities of interaction over peak hours. Mobility system therefore inte-
grates with scale increase and disintegrates with scale decrease. This
finding might
be trivial, but it has interesting implications hypothetically beyond the lines of
transportation research.
This paper did not even touch details of the subject of precise topology com-
position. Public transport stops are members of the same community consistently
with others, on average, exactly 34 partners, but not over the whole day. From hour
to hour de facto barriers within the urban fabric are crossed by the same or different
network bridges. Knowing where these are located and possibly explained why
exactly there and not in a different place is a suggestion for further developments in
this research.
Search WWH ::

Custom Search