Geoscience Reference
In-Depth Information
RT
¼
T4
T1
ð
1
Þ
RPT
¼
T3
T2
ð
2
Þ
RTT
¼
ð
T2
T1
Þ þ
ð
T4
T3
Þ ¼
ð
T4
T1
Þ
ð
T3
T2
Þ ¼
RT
RPT
ð
3
Þ
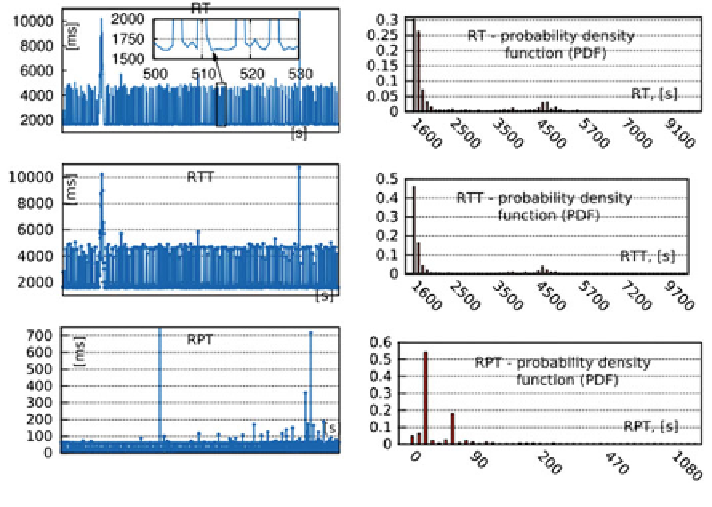
Performance trends and variance results are shown in Fig.
6
. It can be seen that
response times are constant for 50 % (1,600
1,700 ms) samples. 73 % of the
-
sample
s RT were around the 95th percentile. 26 % of samples have uncertain
response time varying from 2 to 11 s (four times more than average value). RTT is
the main part of RT value. Its distribution is very similar to RT as 48 % of RTTs are
between 1,600 and 1,700 ms. One small peak can be found at 4.5 s where 7 % of
samples are situated.
Table
2
shows the statistics of the test. A ratio between standard deviation and
average value is used as an uncertainty measure. From the table we can see that RT
and RTT have a relatively small variance but RPT has signi
'
cant instability which
does not affect the
final RT by much.
A very small amount of samples are signi
cantly affected by RPT giving more
than 1 s to total RT. From this point there is no chance to significantly improve
performance by improving serialization technique (except adding the compression)
or dealing much with the implementation. In our other work we use these results to
predict response time instability formula.
Fig. 6 Performance trends and probability density of RT, RTT, RPT
Search WWH ::

Custom Search