Geoscience Reference
In-Depth Information
in the lunch time (commuting to second shift). For commuting to 3rd work shift
commuting, the value goes down again and represents only 26 % of the maximal
value. These changes generally demonstrate the signi
cant differences between
accessibilities measured for different time intervals during a day.
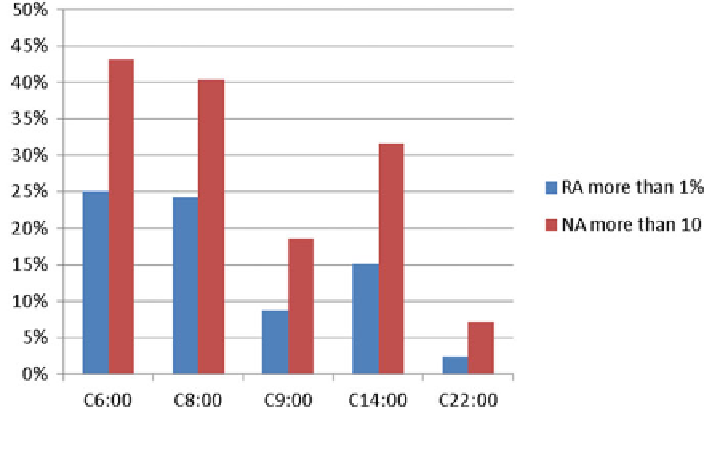
If a certain limit is adopted to de
ne well accessible residential municipalities, i.
e., those with 1 % as minimal level of accessible municipalities (within 100 km) in
the given time interval, even stronger differences in results are revealed (Fig.
1
).
The average accessibility for time interval 7:30
8:45 is only 35 % of the accessi-
bility for the early morning time interval. RA for time interval 12:30
-
13:45 is about
-
61 % and only 10 % for time interval 20:30
21:45.
-
ed also in absolute values as the number
of accessible municipalities within 100 km (NA). Obviously, this indicator provides
more concrete insight into the number of potential destinations and choices for
commuting. Nevertheless there are also serious drawbacks, mainly variable size of
municipalities and the edge effect near national border [
16
].
The distribution of municipalities according to the number of accessible desti-
nations on speci
The level of accessibility can be speci
ed time intervals is depicted in Table
2
and Fig.
2
. Early morning
(C6, C8) and afternoon (C14) time intervals are characterized by similar results,
while results for late morning (C9) and late evening (C22) intervals reveal much
worse values. From all 6,252 municipalities, there are about 1,000 without com-
muting possibility for commuting at 4:30
-
5:45 and 6:30
-
7:45, about 1,400 at
12:30
13:45, but about 2,900 at 7:30
8:45 (almost three times more than 1 h
-
-
before) and almost 4,000 at 20:30
21:45. Based on these results, 6, 8, or 14 o
'
clock
-
Fig. 1 The share of well accessible municipalities (above limits in RA and NA) according to the
time of day

Search WWH ::

Custom Search