Geoscience Reference
In-Depth Information
positive/negative in
fl
uence to the road traf
c intensity in that span. The
final cal-
culation of the average values of correlation coef
cients (one value for one indicator
of all cities unlike the sums mentioned above) was used to show what the depen-
dence of road traf
c intensity in all cities to indicators as one value for each
indicator. This value does not show variability of individual cities as it smoothens
them out by averaging.
4.2 Multiple Linear Regression
Multiple linear regression (MLR) is a multivariate statistical technique. It was
performed on software called SPSS (Statistical Package for the Social Sciences).
SPSS is a computer program used for statistical analysis and further for survey
authoring and deployment, data mining, text analytics, and collaboration and
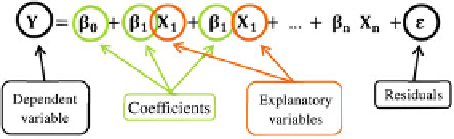
deployment. MLR can model the linear relationship between a dependent variable
and more than one explanatory (independent) variable. The mathematical formula
applied to the explanatory variables to best explain or predict the dependent vari-
able is the following:
A dependent variable (ARTI) is the variable representing the process which
should be predicted or understood. Explanatory variables (attributes of population,
land use, etc.) are the variables used to model or to predict the dependent variable
values. The dependent variable is a function of
the explanatory variables.
Regression coef
cients are values, one for each explanatory variable, that represent
the strength and the type of the relationship the explanatory variable has to the
dependent variable [
12
]. There are a few main assumptions of a regression analysis.
1. Independent variables should not be highly intercorrelated (the assumption of
the absence of multicollinearity). Multicollinearity leads to an unstable corre-
lation matrix and can produce unreliable regression estimates, signi
cance
dence intervals.
2. There will not be outliers that could distort results.
3. The variables are related in a linear fashion. Since multiple regression is based
on Pearson
levels and con
cient, which is only sensitive to linear relation-
ships, gross departures from linearity will mean that important relationships will
remain undetected.
4. The variables are normally distributed [
13
].
'
is correlation coef
Search WWH ::

Custom Search