Biomedical Engineering Reference
In-Depth Information
crystallisation
glass
transition
liquidus
processing
window
T
g
T
o
T
p
T
I
Temperature
Figure 4.7
Schematic of DSC trace of a glass showing glass transition temperature
(
T
g
), crystallisation onset temperature (
T
o
), crystallisation peak temperature (
T
p
)as
well as liquidus temperature (
T
l
).
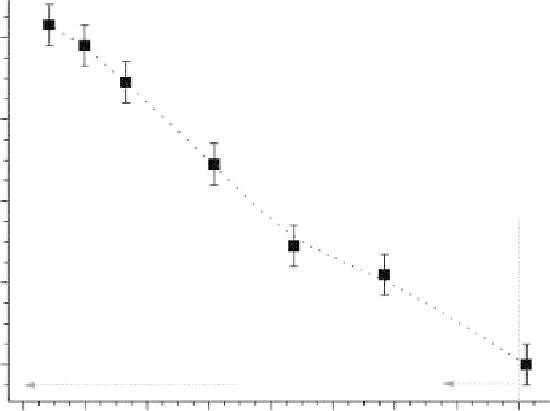
620
600
580
560
540
polyphosphate glasses
34
36
38
40
P
2
O
5
content (mol%)
42
44
46
48
50
Figure 4.8
Glass transition temperature (
T
g
)ofbinaryP
2
O
5
-MgO glasses versus
nominal P
2
O
5
content.
(Adapted with permission from [6]. Copyright (2003)
Elsevier Ltd.)