Graphics Programs Reference
In-Depth Information
Figure 3-28.
Creating a layer on which to make a gamma adjustment
3.
Open the Levels dialog box (Image Menu
➤
Colors
➤
Levels). The histogram
shows the two valleys in the middle area (on either side of the data spike).
The highlighted end of the histogram is a bit shy of data as well (Figure
3-29
).
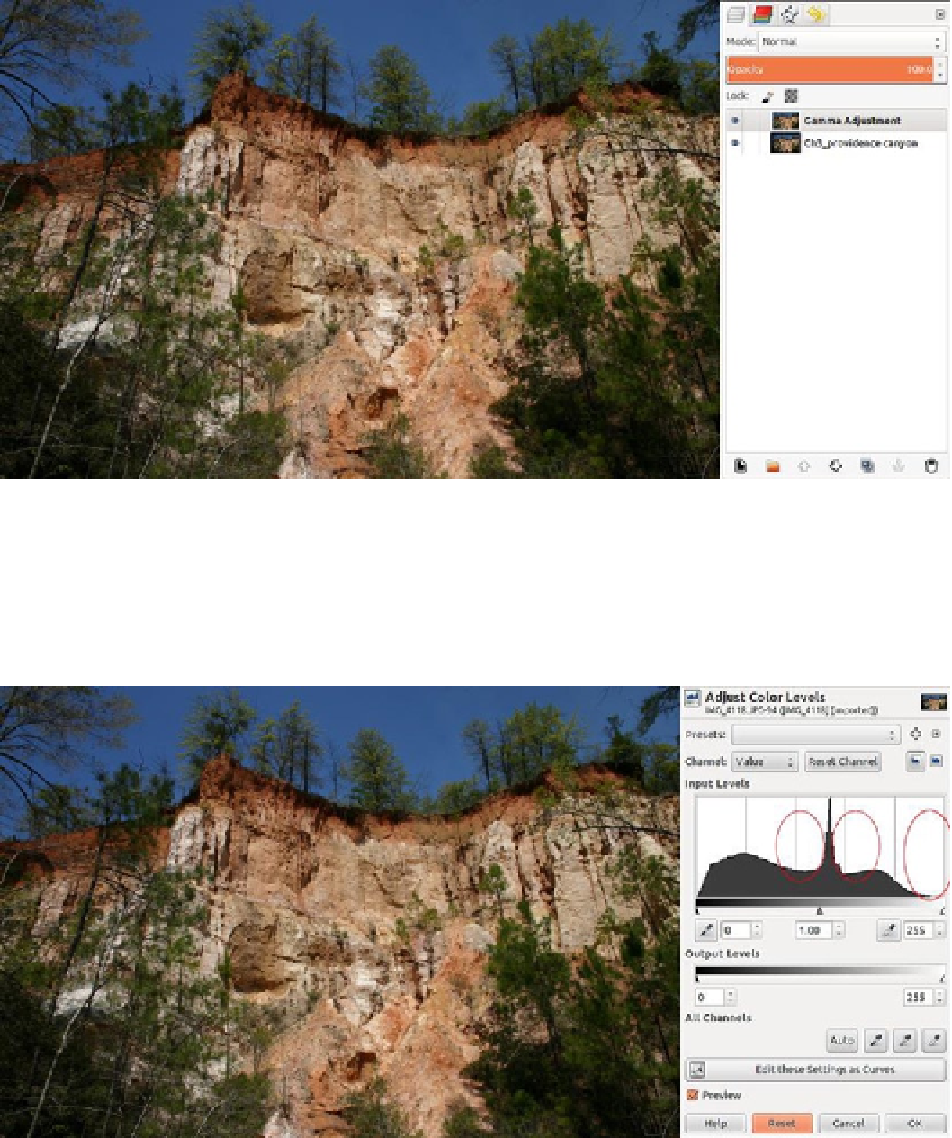
Figure 3-29.
The two valleys in the mid-range area indicate a lack of some image data
Search WWH ::

Custom Search