Graphics Reference
In-Depth Information
The following example creates a three-dimensional kite graph (Figure
4-30
).
>> t = - 10 * pi: pi / 250:10 * pi;
comet3((cos(2*t) .^ 2) .* sin(t),(sin(2*t) .^ 2) .* cos(t),t);
Figure 4-30.
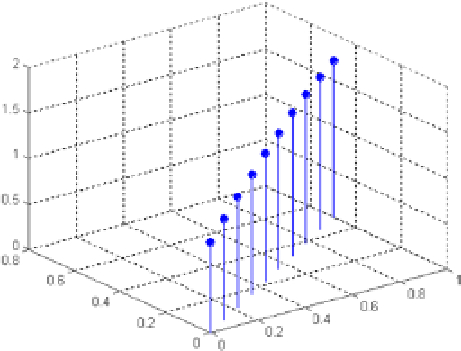
The following is the syntax that creates a graph of stems to display a function of two variables (Figure
4-31
).
>> X = linspace(0,1,10);
Y = X / 2;
Z = sin (X) + cos (Y);
stem3(X,Y,Z,'fill')
Figure 4-31.
Then draw the field unit with equal axes (Figure
4-32
).
>> sphere
axis equal