Graphics Reference
In-Depth Information
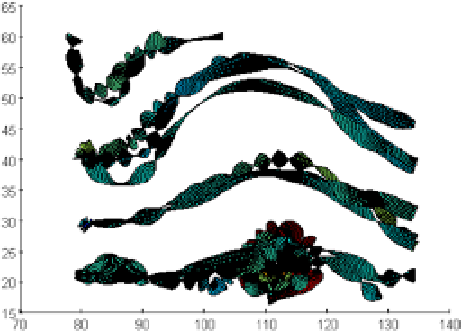
Figure 4-15.
Figure 4-16.
4.2 Specialized Graphics
There are several types of specialized graphics that can be done with MATLAB (areas, boxes, graphics, three-
dimensional sectors of Pareto, etc.) by using the commands that are presented in the following table.
area(Y)
area(X, Y)
Makes the areas graph proportional to the values relative to the frequencies vector.
When X is provided it represents the values of the X axis, at which each corresponding
Y value will be plotted.
Specifies the lower limit in the Y axis direction of the fill area
area(…,ymin)
box
on, box off
Enable / disable boxes in axes for y in 3-D and 2-D graphics.
comet(y)
comet(x, y)
Makes the comet graphic relative to the vector of frequencies y
Performs the comet graphic relative to the frequencies vector Y whose elements are
given by the vector X.
Comet graph with body of length p * length
comet(x, y, p)
(
continued
)


