Graphics Reference
In-Depth Information
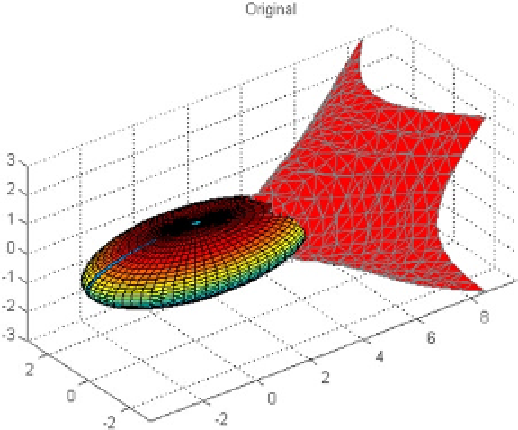
Figure 4-11.
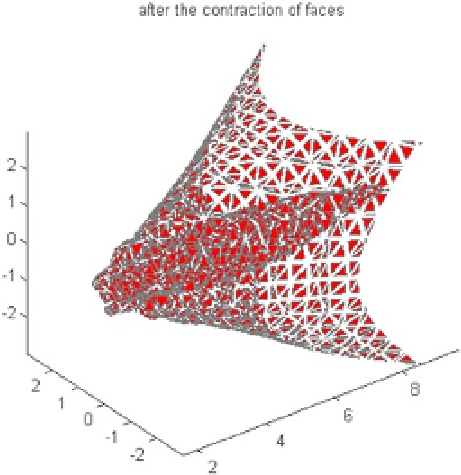
Figure 4-12.
The following creates a chart with lines of two dimensional current (Figure
4-13
) and then for three-dimensional
(Figure
4-14
).
>> load wind
[sx,sy] = meshgrid(80,20:10:50);
streamline(stream2(x(:,:,5),y(:,:,5),u(:,:,5),v(:,:,5),sx,sy));
>> load wind
[sx sy sz] = meshgrid(80,20:10:50,0:5:15);
streamline(stream3(x,y,z,u,v,w,sx,sy,sz))
view(3)