Graphics Reference
In-Depth Information
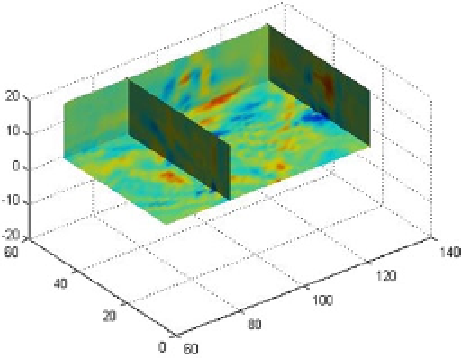
The following example represents the divergence of the vector field given by
wind.mat
using sections with
colored drawings (Figure
4-7
).
>> load wind
div = divergence(x,y,z,u,v,w);
slice(x,y,z,div,[90 134],[59],[0]);
shading interp
daspect([1 1 1])
camlight
colormap jet
Figure 4-7.
Below is an example concerning colors and normal for a given isosurface (Figure
4-8
).
>> [x y z] = meshgrid(1:20,1:20,1:20);
data = sqrt(x.^2 + y.^2 + z.^2);
cdata = smooth3(rand(size(data)),'box',7);
p = patch(isosurface(x,y,z,data,10));
isonormals(x, y, z, data, p);
isocolors(x, y, z, cdata, p);
set(p,'FaceColor','interp','EdgeColor','none')
view(150,30); daspect([1 1 1]);axis tight
camlight; lighting phong;