Graphics Reference
In-Depth Information
Figure 4-3.
They are then drawn as contours in planar sections of volumes on the data set
wind.mat
with a suitable point of
view (Figure
4-4
).
>> [x y z v] = flow;
h = contourslice(x,y,z,v,[1:9],[],[0],linspace(-8,2,10));
axis([0,10,-3,3,-3,3]); daspect([1,1,1])
set(gcf,'Color',[.5,.5,.5],'Renderer','zbuffer')
Figure 4-4.
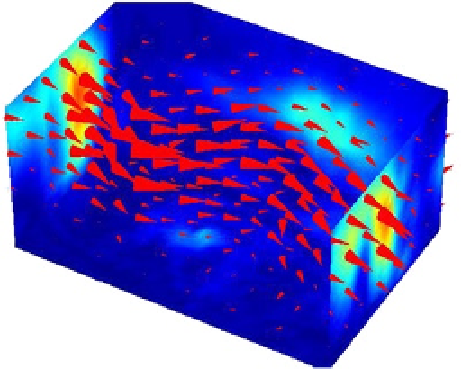
The following example shows the rotational vector field given by
wind.mat
using sections with colored drawings
(Figure
4-5
).
>> load wind
cav = curl(x,y,z,u,v,w);
slice(x,y,z,cav,[90 134],[59],[0]);
shading interp
daspect([1 1 1]); axis tight
colormap hot(16)
camlight