Graphics Reference
In-Depth Information
Figure 3-17.
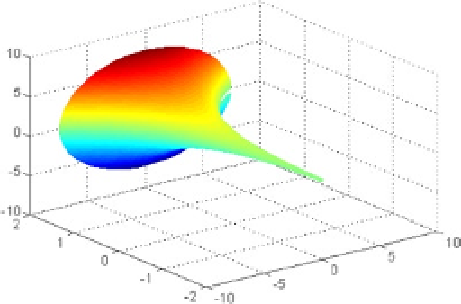
if we propose this matlaB entry:
r =(0:0.1:2*pi)';
t =(-2:0.1:2);
X= cos (r)*exp (t);
Y= ones(1, size(r))'*t;
Z= sin(r)*exp (t);
surf(X,Y,Z), shading interp
You get the graph in figure
3-18
, which has been found in the same way as the previous one, but rotating the
exponential function around the Y axis (the generating curve is now the function
e ^ x
).
Figure 3-18.