Graphics Reference
In-Depth Information
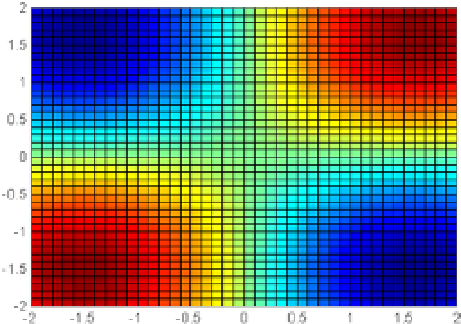
Figure 3-13.
3.8 Manipulating Three-Dimensional Graphics
There are commands in MATLAB which allow you to change the appearance of the same graph, either by your shader,
the scale of its themes, colors, hidden lines, the point of view from which one can observe it, etc. Below, some of these
commands are:
axis([xmin ymin, ymax, zmin zmax max
x
])
places intervals of variation of the axes at
the indicated values. It lso accepts the options
'ij'
,
'square'
,
'equal'
, etc, identical to those
already seen for two dimensions.
view([x, y, z])
places the point of view of the figure at the point's Cartesian coordinates
(x, y, z)
.
view([az, el])
puts the angle of view of the figure in the point of azimuth (horizontal
rotation)
'az'
and elevation (vertical lift)
.
hidden
controls the presence of hidden lines in the graph. These lines come with
hidden on
and go with
hidden off.
shading
controls the type of shadow of a surface created with commands
surf
,
mesh
,
pcolor
,
fill
and
fill3
. The option
shading flat
situates a smooth shading option. The option
shading
interp
implements dense shading and the option
shading faceted
(the default) opts for
normal shading.
colormap(M)
locates the matrix
M
as the current color map.
M
must have three columns
and only contain values between 0 and 1. It can also be a matrix whose rows are vectors
RGB type
[r g b].
All arrays must have 3 columns and
p
rows.
Brighten(p)
adjusts the lighting of the figure. The variation of
p
is the interval
(-1,1)
, and
as the values of
p
approach
- 1
, the figure darkens, while as
p
values approach
1
, the figure
illuminates.
image(A)
produces a two-dimensional image with colors based upon the values of the
elements of the array A, and is used to display photographs and drawings adapted to
the specified colormap. Each element
(m, n)
of the matrix
A
affects a rectangular section
of the image.
caxis([cmin cmax])
places the minimum and maximum values of the color scale (defined
by the colormap and intrinsically related to the divisions that are made in the axes via grids)
for a chart. Therefore, it enables you to use only a subset of colors defined by the colormap.