Graphics Reference
In-Depth Information
Commands used in MATLAB for the representation of isographs (contour lines) are as follows:
contour(Z)
draws the outline graph (contour lines) for the
Z
matrix graph. The number of
contour lines to be used are chosen automatically.
contour(Z,n)
draws the graph outline (contour lines) for the
Z
matrix using n contour lines.
contour(x, y, Z, n)
draws the graph outline (contour lines) for the
Z
matrix in the
X
and
Y
axes using scaling defined by the vectors
x
and
y
(with
n
contour lines).
contour3(Z), contour3(Z,n)
and
contour3(x, y, Z, n)
draws the contour in 3-dimensional
plots.
pcolor(X, Y, Z)
draws a graph outline (contour lines) to the matrix
(X, Y, Z)
using a
representation based on densities of colors. It is often called a density chart.
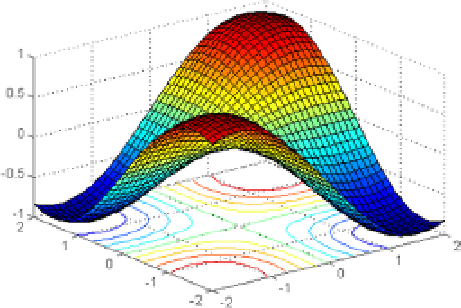
eXerCISe 3-3
Given the surface of equation:
z = sine(x) sine(y) - 2 < x, y < 2
represent it with its contour. then represent its two-dimensional outline with 20 graph lines and its
three-dimensional outline with 50 chart lines. also draw the corresponding density chart.
figure
3-10
shows the graph of the surface with its contour. the syntax is as follows:
>> [X, Y] = meshgrid(-2:0.1:2);
>>
Z
= sin(X) .* sin(Y);
>> surfc(X, Y, Z)
Figure 3-10.
figure
3-11
shows the two-dimensional contour graph using 20 lines. the syntax is as follows:
>> [X, Y] = meshgrid(-2:0.1:2);
>>
Z
= sin(X) .* sin(Y);
>> contour(Z, 20)