Graphics Reference
In-Depth Information
To represent a mesh graph, use the command
mesh
and its variants, whose syntax are as follows:
mesh(X,Y,Z,C)
represents the graph of the mesh function
z = f(x,y)
, drawing the grid lines
that compose the mesh with the colors specified in
C
. The
C
argument is optional.
meshz(X,Y,Z,C)
represents the graph of the mesh function
z = f(x,y)
with a curtain around
the perimeter of the grid that drops to the bottom of the z-axis giving the impression of a
draped tablecloth.
meshc(X,Y,Z,C)
represents the graph of the mesh function
z = f(x,y)
along with a
corresponding contour chart like surfc above (with contour lines projected onto the
XY
-plane).
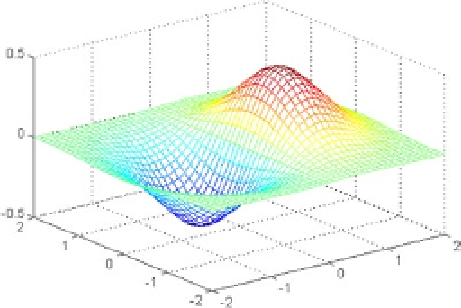
eXerCISe 3-2
represent the mesh graph for the surface of equation:
z = xe
(-x ^ 2 - y ^ 2)
- 2 < x, y < 2
also add their contours (a contour chart) and include a curtain.
the syntax presented here gives as a result the graph in figure
3-7
:
>> [X, Y] = meshgrid(-2:.1:2,-2:.1:2);
>>
Z
= X .* exp(-X.^2 -
Y
.^2);
>> mesh(X, Y, Z)
Figure 3-7.
figure
3-8
presents the mesh along with the contour graph (or contour chart) for the syntax as follows:
>> [X, Y] = meshgrid(-2:.1:2,-2:.1:2);
>>
Z
= X .* exp(-X.^2 -
Y
.^2);
>> meshc(X, Y, Z)