Graphics Reference
In-Depth Information
result in X of 40 columns and 100 rows. Each columns will have the same sequence of values between -10 and +10.
While Y will also have 40 columns and 100 rows, each of the rows will have the same sequence of values between -2
and +2.
The second step is to use the available commands to effect the result, which are as follows:
surf(X,Y,Z,C)
represents the graph of the function's surface
z = f(x,y)
, using the colors
specified in
C
. The
C
argument can be ignored.
surfc(X,Y,Z,C)
represents the graph of the function's surface
z = f(x,y)
with the chart's
corresponding isolines (contour lines projected onto the
X Y
-plane).
surfl(X, Y, Z)
represents the graph of the function's surface
z = f(x,y)
, making the drawing
with shading (highlights from a light source).
eXerCISe 3-1
represent the surface of the slope-intercept form:
(
)
2
2
Sinxy
+
z
=
-14/2 < x, y < 14/2
xy
2
+
2
also represent the surface with its contour.
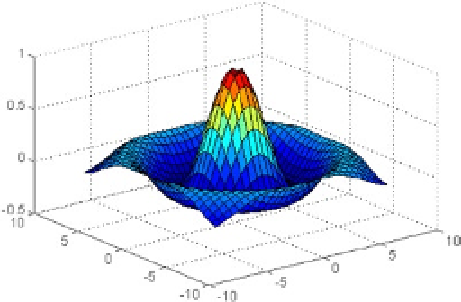
>> [X, Y] = meshgrid(-7.5:.5:7.5);
>>
Z
= sin(sqrt(X.^2+Y.^2))./sqrt(X.^2+Y.^2);
>> surf(X, Y, Z)
this gives the graph of figure
3-4
.
Figure 3-4.