Graphics Reference
In-Depth Information
rose(Y)
draws the angular histogram relative to the vector
and
angles in radians, using 20
equal radii.
rose(Y,n)
draws the vector
Y
angular histogram,
using equal radii.
rose(X,Y)
draws the vector
Y angular
histogram using radii that are specified in the
elements of the vector
X.
compass(Z)
carries out a diagram of arrows coming out of the origin and whose magnitude
and direction are determined by the real and imaginary components of the vector
Z
in
complex numbers. The complex
Zi
arrow joins the origin with the value of
Zi.
compass(X,Y)
is equivalent to
compass (X+i*Y).
compass (Z, S)
or
compass(X, Y, S)
specifies the line type in
S
to use on the arrows.
feather(Z)
or
feather(X,Y)
or
feather(Z,S)
or
feather(X,Y,S)
is the same as
compass
, with
the only difference that the origin of the arrows is not at the origin of coordinates, but out of
equally-spaced points of a horizontal line.
legend('legend1', 'legend2',…, 'legendn')
situates the legends given in
n
consecutive
graphics.
Here are some examples below:
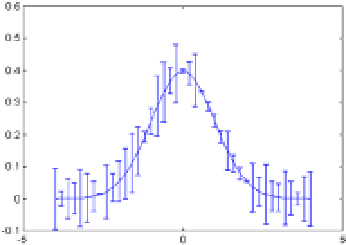
First of all, let's represent in Figure
2-23
a chart of errors for the density of a normal distribution (0,1) function,
with the variable defined in 40 points between - 4 and 4, and errors are being defined by 40 uniform random
values (0.10):
>> x = -4:.2:4;
>> y = (1/sqrt(2*pi))*exp(-(x.^2)/2);
>> e = rand(size(x))/10;
>> errorbar(x,y,e)
Figure 2-23.
We also represent a graph of clusters corresponding to 50 normal random numbers (0.1) by using the syntax
below in Figure
2-24
:
>> y = randn (50,1); stem (y)