Graphics Reference
In-Depth Information
Figure 2-12.
2.7 Graphics Functions in Polar Coordinates
MATLAB enables the specific
polar
command, representing functions in polar coordinates. Its syntax is as follows:
Polar (a, r)
represents the curve in polar coordinates
r = r (a), using theta in radians
.
Polar (a, r, S)
represents the curve in polar coordinates
r = r (a)
with the style of line given
by
S
, whose values were already specified in the command
plot.
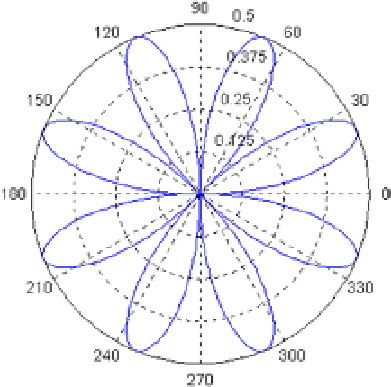
eXerCISe 2-9
represent the graph of the curve whose equation in polar coordinates is as follows:
r = Sine (2a) Cos (2a)
for a
between 0 and 2
p
.
the following syntax leads us to the graph in Figure
2-13
:
>> a = 0:0.01:2 * pi;
>> r = sin(2*a) .* cos(2*a);
>> polar(a, r)
Figure 2-13.