Graphics Reference
In-Depth Information
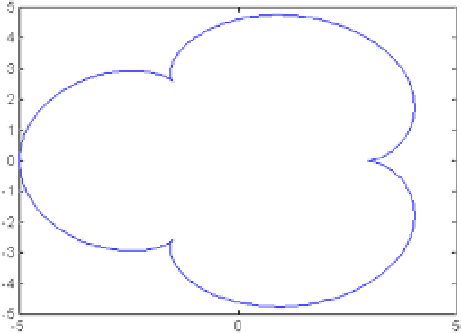
eXerCISe 2-7
represent the curve (epicycloid) whose parametric coordinates are:
x = 4Cos [t] - Cos [4t], y = 4Sine [t] - Sine
[4t]
, for
t
varying between 0 and 2
p
.
the syntax will be as follows:
>> t = 0:0.01:2 * pi;
>> x = 4 * cos (t) - cos(4*t);
>> y = 4 * sin (t) - sin(4*t);
>> plot(x,y)
the graph is presented in Figure
2-11
, and represents the
epicycloid
.
Figure 2-11.
eXerCISe 2-8
represent the graph of the Cycloid whose parametric equations are
x = t-2Sine (t), y = 1-2Cos (t)
, for
t
varying
between - 3
p
. and 3
p
.
we will use the following syntax:
>> t = - 3 * pi:0.001:3 * pi;
>> plot(t-2 * sin (t), 1-2 * cos (t))
this gives you the graph in Figure
2-12
.