Graphics Reference
In-Depth Information
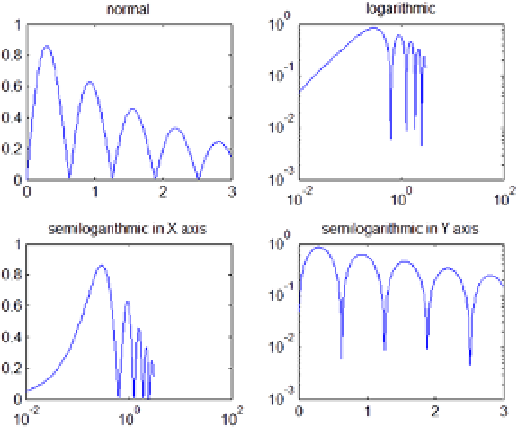
Figure 2-9.
2.5 Polygons
MATLAB also allows drawing polygons in two dimensions. To do this, use the following commands:
fill(X, Y, C)
draws the compact polygon whose vertices are pairs of coordinates
(Xi, Yi)
of the column vectors
X
and
Y.
If C is a vector of the same size of
X
and
Y
, it contains the
color map index
Ci
for each point
(Xi, Yi) as scaled by c axis
. If C is a single character, all
the points of the polygon will be painted the color corresponding to the character. The
Ci
values may be:
'r', 'g', 'b', 'c', ', 'y', 'w', 'k'
, whose meanings we already know. If
X
and
Y
are matrices of the same size, several polygons will be represented at the same time
corresponding to each pair of column vectors
(X.j, Y.j).
In this case,
C
can be a vector row
Cj
elements determine the unique color of each pair of vectors for polygon column
(X.j, Y.j). C
can also be a matrix of the same dimension as
X
and Y, in which case its
elements determine the color of each point
(Xij, Yij)
in the set of polygons.
fill(X1,Y1,C1,X2,Y2,C2,…)
draws multiple compact polygons whose vertices are given by
the points
(Xi, Yi, Ci)
, the meaning of which we already know.