Graphics Reference
In-Depth Information
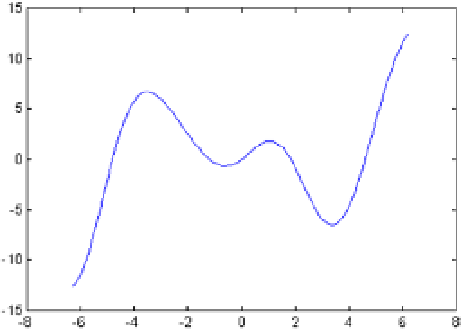
Figure 2-1.
The same graph is obtained using the command
fplot
with the following syntax:
>> fplot ('sin(x) ^ 2 + 2 * x * cos(x)', [- 2 * pi, 2 * pi])
And the same representation can be obtained by using the command
ezplot
using the following syntax:
>> ezplot ('sin(x) ^ 2 + 2 * x * cos(x)', [- 2 * pi, 2 * pi])
Observe that in the last two cases functions are expressed symbolically, and not as a vector, as in the form of the
first case. (Note the quotes surrounding the function).
MATLAB draws not only bounded functions, but it also represents features that have asymptotes and
singularities. For example, Figure
2-2
shows the graph of the function y = x ^ 3 /(x^2-4) which has asymptotes for x at
-2 and 2 in the range of variation of
x
given by
(- 8,8)
by using the command:
>> ezplot ('x ^ 3 / (x^2-4)', [- 8, 8])
Figure 2-2.