Graphics Reference
In-Depth Information
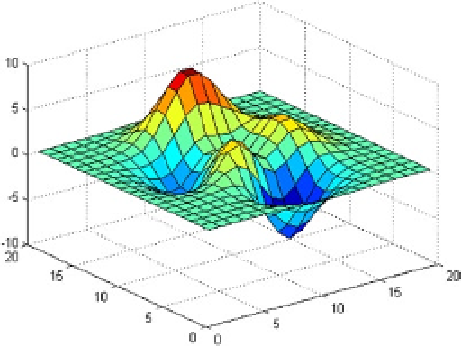
In the following example (Figure
5-31
), we represent a surface utilizing the function
peaks
predefined in MATLAB
(similar to a two-dimensional Gaussian distribution) with change of origin and scale.
>> surf(peaks(20))
Figure 5-31.
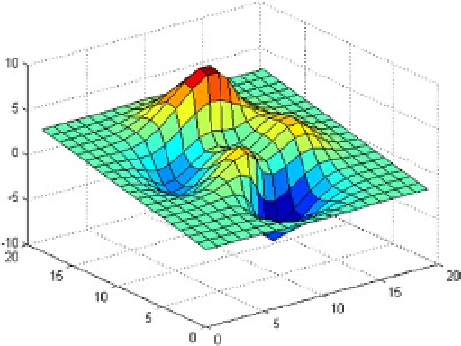
Then we rotate the figure above 180 degrees around the axis X (Figure
5-32
).
>> h = surf(peaks(20));
rotate(h,[1 0 0],15)
Figure 5-32.
Then we change the center and rotate the start surface 45° in the direction of the axis
z
(Figure
5-33
).
>> h = surf(peaks(20));
zdir = [0 0 1];
center = [10 10 0];
rotate(h,zdir,45,center)